Accuracy of Radiosonde humidity soundings for contrail prediction

Belfrey

Senior Member.
I noticed that Harold Saive was talking about this website again on his Facebook page.
i272.photobucket.com_albums_jj182_BelfreyE_HaroldFB9_3.jpg


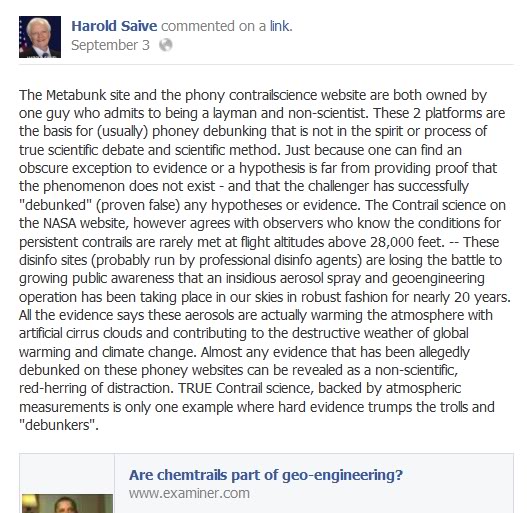
Some interesting things there - he suggests that we are actually just providing "obscure exception(s) to evidence." He may be referring to the rainfall sampling results from older journal articles. What these actually do is show evidence that the results from his own rainfall sample are well within the normal range (actually on the low side) compared to common results from well before chemtrails supposedly started. The evidence from the scientific literature certainly does falsify the claim (made by Saive and others) that there should be absolutely no Al, Ba, or Sr in ordinary rainwater - a claim that I've never seen the believers try to support with evidence or reliable sources.

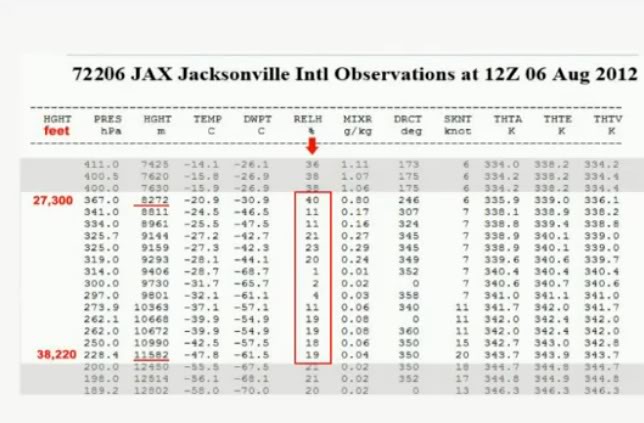
Interestingly, Saive has recently started to admit that persistent contrails exist, but now he claims that they can't happen at typical cruising altitude. He's started using this "conditions are bad for contrail formation above 28,000 feet according to NASA" claim a lot. As far as I can tell, it's based solely on results from a single weather balloon flight from Jacksonville (see Debunking NASA's Persistant Contrail Myth Using Weather Sonde Data), which shows low RH at flight altitude on a day (8/12/12) that he says contrails were reported as present in Jax:
i272.photobucket.com_albums_jj182_BelfreyE_HaroldJax8_12a.jpg


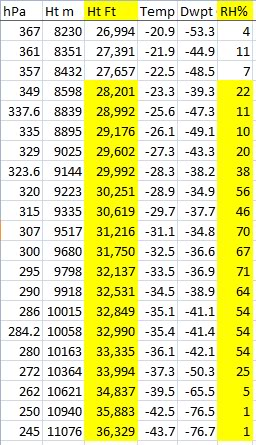
Of course, a weather balloon flight only samples one little spot in the sky at one point in time, and those conditions are not uniform or constant - if it happened to fly right through an area of sky where contrails were simultaneously being produced, that might be saying something. A single sample certainly does not show what is "typical" as Saive has been claiming. In fact, the balloon flight from Jacksonville for later that same day shows much higher RH (up to about 70%) for typical cruising altitudes:
i272.photobucket.com_albums_jj182_BelfreyE_Jax8_12b.jpg
[/S]
 
Last edited by a moderator:
The bottom line. The NASA website Saive sends people to doesn't provide enough information for a person to predict contrail
persistence using upper air sounding data.

From the beginning, twelve years ago I contacted Dr. Patrick Minnis, probably the foremost NASA expert on contrails, and asked him to explain things to the "chemtrail conscious activist collective". He did so here, posting as "Canex": LINK

You can flesh out more about the subject by an advanced google search of the chemtrailcentral,com domain using the term "Canex", which was Dr. Minnis' screen name at the forum. SEARCH LINK

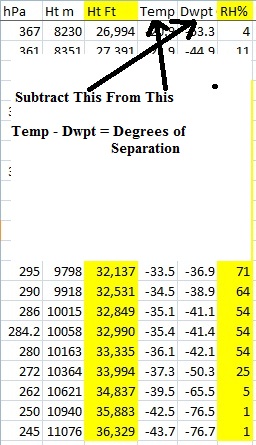
The essential factor which Saive has missed is that Relative Humidity (RH%) as shown on the upper air data above, isn't "relative humidity with respect to ice" (RHi​), a very important distinction. The only way to get a completely accurate (RHi​) is to send up a special radiosonde capable of the measurement. The ordinary balloon-borne radiosonde doesn't directly measure (RHi​).

You can get some idea of the (RHi​) by calculating the difference between the temperature at the particular altitude and the dewpoint temperature of that same altitude. That difference is called the "degrees of separation". The closer to zero that difference is, the closer the atmosphere is to an (RHi​) of 100%.

Here is the calculation: Temperature at altitude(Temp) - Dewpoint temperature(DWPT) = degrees of separation
Jax8-12b.jpg

Example:
for the 32,137 ft. altitude, 36.9 - 33.5 = 3.4 degrees of separation
for the 34,837 ft. altitude, 39.5 - 65.5 = 26.0 degrees of separation
These calculations show that there is a higher degree of separation at the 34,837 ft. altitude.
However, notice that the temperature at the higher altitude (-39.5) is just barely close to the critical contrail formation temperature of -40C, while the temperature at the lower altitude is even warmer (-33.5)? Judging strictly by the degrees of separation, you could say that the lower altitude has a greater likelihood, but do not forget that the contrail formation criteria calls for a temperature below -40C.

Therein lies but one of the problems with using radiosonde data to predict either formation or persistence likelihoods. As Belfry noted above, the balloon is launched twice/day, and it drifts with whatever direction the wind takes it. It might start out in one direction, and at a different altitude head off in an entirely different direction, and do that same thing several times. This video shows a student group launching a ballon, you can see that it quickly heads off horizontally from the point of release. Even at 20 mph windspeed, an average radiosonde ascends at 1000 ft/ minute, so before it reaches 30,000 feet altitude, 1/2 hour has passed, and the ballon would have traveled 10 miles from it's point of release. However, what if the baloon were released six hours before or after the contrail observation time? In six hours, at 20 miles/hour, the balloon would have traveled 120 miles from the point of release!


In the final analysis, it is only possible to get a general idea from upper air data of whether or not contrail formation or persistence conditions exist.
Hope this helps.
 

Attachments

  • silhouette.jpg
    silhouette.jpg
    7.1 KB · Views: 882
Last edited by a moderator:
I've used the following chart as guide for interpreting radiosonde data. It shows how relative humidity compares to relative humidity with respect to ice at different temperatures. I don't remember where I got it and I'm not sure how accurate it is.


[TABLE="class: grid, width: 500, align: left"]
[TR]
[TD]°C[/TD]
[TD]RH[/TD]
[TD]RHi[/TD]
[/TR]
[TR]
[TD][/TD]
[TD][/TD]
[TD][/TD]
[/TR]
[TR]
[TD]0[/TD]
[TD]100%[/TD]
[TD]100%[/TD]
[/TR]
[TR]
[TD]-10[/TD]
[TD]90.7%[/TD]
[TD] 100%[/TD]
[/TR]
[TR]
[TD]-20[/TD]
[TD]82.2%[/TD]
[TD]100%[/TD]
[/TR]
[TR]
[TD]-30[/TD]
[TD]74.5%[/TD]
[TD]100%[/TD]
[/TR]
[TR]
[TD]-40[/TD]
[TD]67.4%[/TD]
[TD]100%[/TD]
[/TR]
[/TABLE]
 
The essential factor which Saive has missed is that Relative Humidity (RH%) as shown on the upper air data above, isn't "relative humidity with respect to ice" (RHi​), a very important distinction. The only way to get a completely accurate (RHi​) is to send up a special radiosonde capable of the measurement. The ordinary balloon-borne radiosonde doesn't directly measure (RHi​).

You can get some idea of the (RHi​) by calculating the difference between the temperature at the particular altitude and the dewpoint temperature of that same altitude. That difference is called the "degrees of separation". The closer to zero that difference is, the closer the atmosphere is to an (RHi​) of 100%.

That's not correct Jay. The difference between dewpoint and temperature relates to RHw​, not RHi

What you need is the difference between temperature and frostpoint.

http://www.theweatherprediction.com/habyhints/347/

External Quote:

The dew point is the temperature at which the air is saturated with respect to water vapor over a liquid surface. When the temperature is equal to the dewpoint then the relative humidity is 100%. The common ways for the relative humidity to be 100% is to 1) cool the air to the dewpoint, 2) evaporate moisture into the air until the air is saturated, 3) lift the air until it adiabatically cools to the dew point.

The frost point is the temperature at which the air is saturated with respect to water vapor over an ice surface. It is more difficult more water molecules to escape a frozen surface as compared to a liquid surface since an ice has a stronger bonding between neighboring water molecules. Because of this, the frost point is greater in temperature than the dew point. This fact is important to precipitation growth in clouds. Since the vapor pressure is less over an ice surface as compared to a supercooled liquid surface at the same temperature, when the relative humidity is 100% with respect to water vapor the relative humidity over the ice surface will be greater than 100%. Thus, precipitation growth is favored on the ice particles.

The frost point is between the temperature and dewpoint.
The relationship between RHw and RHi is complicated but at regular contrail altitudes you get 100% RHI ​at between 60 and 70% RHW (regular RH).

Contrails need RHW​ temporarily raised over 100% to form, and then RHI ​ambiently over 100% to persist and grow.

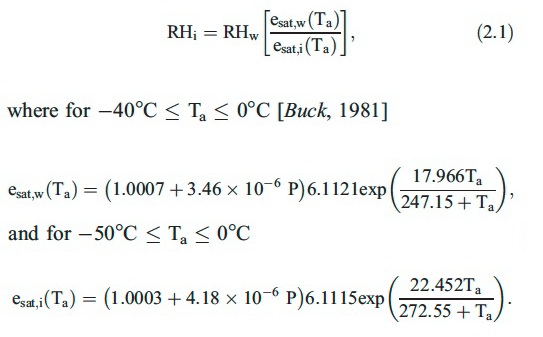
Here's the code I use to convert RHW to RHI based on pressure and temp:
Code:
# convert RHw to RHi, as per 
# http://www.esrl.noaa.gov/psd/people/ola.persson/polar_studies/refereed/Ice_sat_2000JC000411.pdf
# But see http://cires.colorado.edu/~voemel/vp.html
# ta = temperature of atmosphere, in Celsius
# p = pressure in hPa (hectopascals), which are the same as mb (millibars)
# note this is defined as accurate from -0C to -50C, but it's unclear how inaccurate it is
# at temperatures below -50C
def rhw2rhi(rh, ta, p)
      e_sat_w_Ta = (1.0007 + 0.00000346 * p)*6.1121*Math.exp((17.966*ta)/(247.15+ta));
      e_sat_i_Ta = (1.0003 + 0.00000418 * p)*6.1115*Math.exp((22.452*ta)/(272.55+ta));
      return rh * (e_sat_w_Ta/e_sat_i_Ta);
end

From:
http://www.esrl.noaa.gov/psd/people/ola.persson/polar_studies/refereed/Ice_sat_2000JC000411.pdf

contrailscience.com_skitch_Ice_sat_2000JC000411.pdf.jpg__40_1081a9a11d1f6ca927226668a00d472f38.jpg
 
Last edited:
That's not correct Jay. The difference between dewpoint and temperature relates to RHw​, not RHi

What you need is the difference between temperature and frostpoint.

I didn't say it was how to calculate RHi, I said, "You can get some idea of the (RHi).....The closer to zero that difference is, the closer the atmosphere is to an (RHi) of 100%."
The special instrument I mentioned in passing was, of course, a frostpoint hygrometer.

Thanks for showing the complete calculations. Harold Saive will have that down right away.......:rolleyes:
 
I didn't say it was how to calculate RHi, I said, "You can get some idea of the (RHi).....The closer to zero that difference is, the closer the atmosphere is to an (RHi) of 100%."

But that implies that if the difference is zero then RHi would be 100%, whereas in reality RHi would be more like 130% (supersaturated). It gets to 100% with still a considerable difference between temperature and dewpoint.
 
Interestingly, Saive has recently started to admit that persistent contrails exist, but now he claims that they can't happen at typical cruising altitude. He's started using this "conditions are bad for contrail formation above 28,000 feet according to NASA" claim a lot. As far as I can tell, it's based solely on results from a single weather balloon flight from Jacksonville (see Debunking NASA's Persistant Contrail Myth Using Weather Sonde Data), which shows low RH at flight altitude on a day (8/12/12) that he says contrails were reported as present in Jax:

For the sake of accuracy, the radiosonde data is from Aug. 6, 2012 at 12Z. Note the header for the text file states: "...Observations at 12Z 06 Aug 2012"

Here's the radiosonde observations for later that day valid for Aug. 7 2012 at 00Z:

72206 JAX Jacksonville Intl Observations at 00Z 07 Aug 2012

375.0 8114 -18.9 -22.0 76 1.76 133 4 336.5 343.0 336.9
292.0 9929 -32.5 -37.5 61 0.52 104 6 342.1 344.2 342.2
178.0 13204 -62.1 -69.1 39 0.02 46 10 345.6 345.7 345.6

However, as Jay said, radiosonde data is only valid for a tiny sliver of the atmosphere at a certain point in time, thus at best providing a general idea of conditions at various altitudes. The radiosonde data is valid for 8 a.m. and 8 p.m. local time, that leaves the entire day devoid of current radiosonde data. Anything can happen in the atmosphere over the course of twelve hours, especially at a coastal location during the prime hours of daytime heating. Persistent contrail conditions could be met at any time between the early morning and late evening weather balloon launches.
 
Of course, a weather balloon flight only samples one little spot in the sky at one point in time, and those conditions are not uniform or constant - if it happened to fly right through an area of sky where contrails were simultaneously being produced, that might be saying something. A single sample certainly does not show what is "typical" as Saive has been claiming. In fact, the balloon flight from Jacksonville for later that same day shows much higher RH (up to about 70%) for typical cruising altitudes:

That's not later the same day (06 Aug), it's six days later (12 Aug).

I can see why Harold thinks the radiosonde figures say contrails are rare. I analyzed all this years figures for Jacksonville for RHI>100% and Temp <-40C. I did the same for Vandenberg CA (the closest to me).

Vandenberg had persistent contrail conditions on 22% of the days this year.

Jacksonville had persistent contrail condition on 0% of the days this year.

That's right. ZERO!

The problem seems to be that the radiosonde used in Jacksonville cannot accurately measure RH if the temperature is below -40, whereas the Vandenberg one can. Clearly they are different instruments, as Vandenberg records RH accurate to 0.1C, whereas Jacksonville is accurate to 1.0C (and I suspect is worse than that).

This requires some investigation.
 
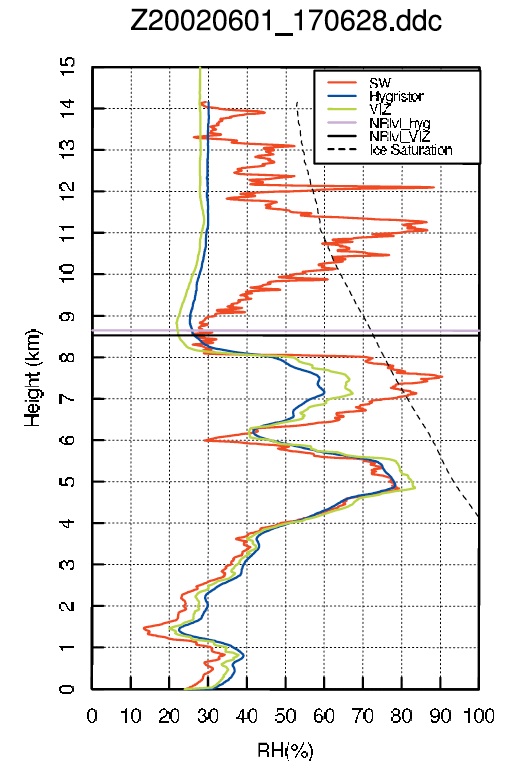
Here's a comparison of different types of RH instrumentation. In this graph they are all measuring the same thing, but get different results.

http://radiometrics.com/data/uploads/2012/11/Refsonde-GRL.pdf

contrailscience.com_skitch_Refsonde_GRL.pdf_20120908_103217.jpg


The dashed line is ice saturation. So if the RH goes to the right of this then contrails can persist. The red line is an accurate hygrometer, and you can see that the red line goes over the dashed line at 7500m and around 11,000m and 12,000m.

The blue and green lines are cheaper inaccurate hygrometers. At 7,500m they read too dry. Above 8,600m they basically freeze up and stop working.

The SW line is the only type that keeps working above 8000m (26,000) feet. By the jaggedness of the curve you can see it's higer resolution as well. So I suspect this account for the discrepancy between Vandenberg and Jacksonville.

 
Last edited:
some of the radiosondes used have a "dry bias" this is discussed by Minnis.
http://www.chemtrailcentral.com/ubb/Forum1/HTML/000101.html

It's not just the dry bias though. They actually entirely stop working at a certain altitude (well, kind of a random altitude actually, but high and cold) and the data returned after is entirely meaningless.
contrailscience.com_skitch_Refsonde_GRL.pdf_20120908_103217.jpg

In the graph above you can see the dry bias between 6 and 8 km (peaks at 65% when it's actually 85%), then it just stops working (the NRL - No Response Level)

If you look at the ice saturation line though, you'd see both the dry bias and the failure both hide conditions of ice super saturation - a small one at 7500m is hid by the dry bias, and a much larger one is hidden by the NRL at 10,000 to 11,000m.
 
Last edited:
Looking at some Skew-T diagrams for Jacksonville, it looks like it possibly goes non-responsive frequently when conditions are right for contrail formation. I suspect it's kind of icing over. In the diagrams where it seems to keep working all the way up, the humidity is low (big gap between dewpoint and temperature)

This is all very unfortunate, and greatly complicates explaining the situation.

Fortunately we can still focus on the stations that have accurate humidity measurements. I'm glad I live near one.

It would be useful to determine which station have a larger dry bias, and which exhibit NRLs.

My concern with this is that it could come off as, "That doesn't give the expected results, therefore the results are wrong." Even if there are possible instrumentation issues known, it sounds like a cop-out. It would be nice if there were some way to check those Jax results against another measurement for the same region.
 
My concern with this is that it could come off as, "That doesn't give the expected results, therefore the results are wrong." Even if there are possible instrumentation issues known, it sounds like a cop-out. It would be nice if there were some way to check those Jax results against another measurement for the same region.

I know, this is going to be an easy issue for the chemtrail promoters to spin. The science is just a little too complicated, and the "bad instruments", while entirely true, as the paper shows, is going to come off as an excuse.

My initial trawl though the US stations seems to indicate that most of them suffer from this problem. I'm going to do a full analysis of the 2011 data, see what's what.
 
So the only stations that give somewhat reasonable results for -40C altitudes are:

Code:
2011 Caribou 72712 CAR
Jan ***
Feb *********
Mar ***
Apr **
May 
Jun *
Jul *
Aug ****
Sep **
Oct **
Nov 
Dec ***
All contrails/soundings = 30/733 -> 4%
00Z contrails/soundings = 15/360 -> 4%
12Z contrails/soundings = 15/363 -> 4%

2011 Omaha 72558 OAX
Jan **
Feb *****
Mar *****
Apr ***
May **
Jun *
Jul *****
Aug *
Sep 
Oct 
Nov **
Dec *
All contrails/soundings = 27/738 -> 3%
00Z contrails/soundings = 11/362 -> 3%
12Z contrails/soundings = 16/362 -> 4%

2011 Afb 72393 VBG Vandenberg
Jan *******
Feb ****
Mar ********************
Apr ***********
May *******
Jun ****
Jul 
Aug **
Sep ***
Oct ***
Nov 
Dec 
All contrails/soundings = 61/331 -> 18%
00Z contrails/soundings = 7/55 -> 12%
12Z contrails/soundings = 54/276 -> 19%

2011 Island 72402 WAL Wallops
Jan **************
Feb **************
Mar **********
Apr *******
May *********
Jun **********
Jul 
Aug 
Sep ***************
Oct *******
Nov ***********
Dec ***************
All contrails/soundings = 112/606 -> 18%
00Z contrails/soundings = 50/303 -> 16%
12Z contrails/soundings = 62/303 -> 20%

Of course the only soundings that are accurate enough to reflect reality are from an Air Force base (Vandenberg AFB), and from NASA (Wallops), so would likely be met with suspicion.
 
The one station in England seems to be good:

Code:
2011 Camborne 03808 
Jan ****************
Feb ***************
Mar ***********
Apr *************
May **********
Jun *********
Jul **********
Aug *****************
Sep *******************
Oct ******************
Nov ****************************
Dec ******************************
All contrails/soundings = 196/728 -> 26%
00Z contrails/soundings = 171/362 -> 47%
12Z contrails/soundings = 24/364 -> 6%

The ******s next to a month are the number of days that have contrail conditions. 00Z in the UK is midnight, 12Z is noon. Most contrails in the UK will occur in the AM, based on this.
 
Okay, here's a good illustration of the difference, Sterling, VA and Wallops, VA. Just 100 miles apart, and yet in 2011 Sterling has 1 contrail sounding, and Wallops has 62 (and it's missing two months, so likely far more).

2010 has similar figures

Code:
-------------------------------------------------------------
2010 Sterling 72403 IAD
Jan 
Feb 
Mar 
Apr 
May *
Jun 
Jul 
Aug 
Sep 
Oct 
Nov 
Dec 
All contrails/soundings = 1/760 -> 0%
00Z contrails/soundings = 1/361 -> 0%
12Z contrails/soundings = 0/365 -> 0%


-------------------------------------------------------------
2010 Island 72402 WAL Wallops
Jan ********
Feb *********
Mar **************
Apr ******
May ***************
Jun *********
Jul ******
Aug *********
Sep ************
Oct ************
Nov **********
Dec ****************
All contrails/soundings = 126/748 -> 16%
00Z contrails/soundings = 58/364 -> 15%
12Z contrails/soundings = 65/365 -> 17%
 
This is a situation which has existed since the beginning, in 2000. Better to rely on direct telephotography.
Just sayin'..........
 
Okay, here's a good illustration of the difference, Sterling, VA and Wallops, VA. Just 100 miles apart, and yet in 2011 Sterling has 1 contrail sounding, and Wallops has 62 (and it's missing two months, so likely far more).

2010 has similar figures

Code:
-------------------------------------------------------------
2010 Sterling 72403 IAD
Jan 
Feb 
Mar 
Apr 
May *
Jun 
Jul 
Aug 
Sep 
Oct 
Nov 
Dec 
All contrails/soundings = 1/760 -> 0%
00Z contrails/soundings = 1/361 -> 0%
12Z contrails/soundings = 0/365 -> 0%


-------------------------------------------------------------
2010 Island 72402 WAL Wallops
Jan ********
Feb *********
Mar **************
Apr ******
May ***************
Jun *********
Jul ******
Aug *********
Sep ************
Oct ************
Nov **********
Dec ****************
All contrails/soundings = 126/748 -> 16%
00Z contrails/soundings = 58/364 -> 15%
12Z contrails/soundings = 65/365 -> 17%

It's worth noting that the percentages for that Wallops station is similar to Sausen et al. (1998) and Gierens et al. (1999), which found ice supersaturation conditions in 13.5% and 16% of their overall data, respectively.
 
As I was looking up papers about contrail formation for another thread, I ran into Jensen et al. (1998), which mentions (as Jay has repeatedly pointed out) that weather sondes are not accurate enough for looking at the weather factors involved:

External Quote:
Attempts have been made to validate the predicted threshold temperatures using ground-based observations of contrails and nearly colocated radiosonde measurements of temperature and humidity [Peters, 1993; Busen and Schumann, 1995]. However, the inaccuracy of radiosonde humidity measurements and the separation between humidity measurements and the contrails have limited the usefulness of these studies.
 
Back
Top