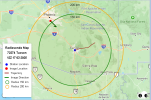
I wanted to share a weather analysis tool / application i have been developing. It calculates RHi at standard flight elevations and max RHi for a single radiosonde data set as well as producing a radiosonde map showing the WMO station location, radiosonde trajectory, contrail image location and direction. The app is somewhat technical so ii thought that the metabunk forum might have some members that would find the application interesting and hopefully useful. And of course suggestions or comments for improvement are always welcome. The app could be considered an extension of Mick's Calculator for RHi and Contrail Persistence Criteria, which i used to verify the RHi calculations in the development of this app which was very helpful.
CONTRAIL ANALYSIS OF PERSISTENCE RHI CALCULATIONS=======
Station ID: 72274 Tucson
Obs Date and Time UTC: 12Z 17 03 2025
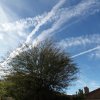
IMAGE: Date and Time UTC: 1420 17 03 2025
LEVELS:
300.0 hPa Elev:9521m T=-38.1°C RH=79% RHi≈114% Persistence:Yes
250.0 hPa Elev:10642m T=-47.5°C RH=52% RHi≈82% Persistence:No
200.0 hPa Elev:12040m T=-58.9°C RH=55% RHi≈96% Persistence:Yes
Max RHi (7,000-14,000m): 222.0 hPa Elev:11521m T=-55.0°C RH=68% RHi=115%
CONCLUSION: Persistent contrails possible max RHi=115%
Link to app: Contrailwx.info
CONTRAIL ANALYSIS OF PERSISTENCE RHI CALCULATIONS=======
Station ID: 72274 Tucson
Obs Date and Time UTC: 12Z 17 03 2025
IMAGE: Date and Time UTC: 1420 17 03 2025
LEVELS:
300.0 hPa Elev:9521m T=-38.1°C RH=79% RHi≈114% Persistence:Yes
250.0 hPa Elev:10642m T=-47.5°C RH=52% RHi≈82% Persistence:No
200.0 hPa Elev:12040m T=-58.9°C RH=55% RHi≈96% Persistence:Yes
Max RHi (7,000-14,000m): 222.0 hPa Elev:11521m T=-55.0°C RH=68% RHi=115%
CONCLUSION: Persistent contrails possible max RHi=115%
Link to app: Contrailwx.info