Contrail Science Interactive Flights Map (beta)

Mick West

Administrator
Staff member
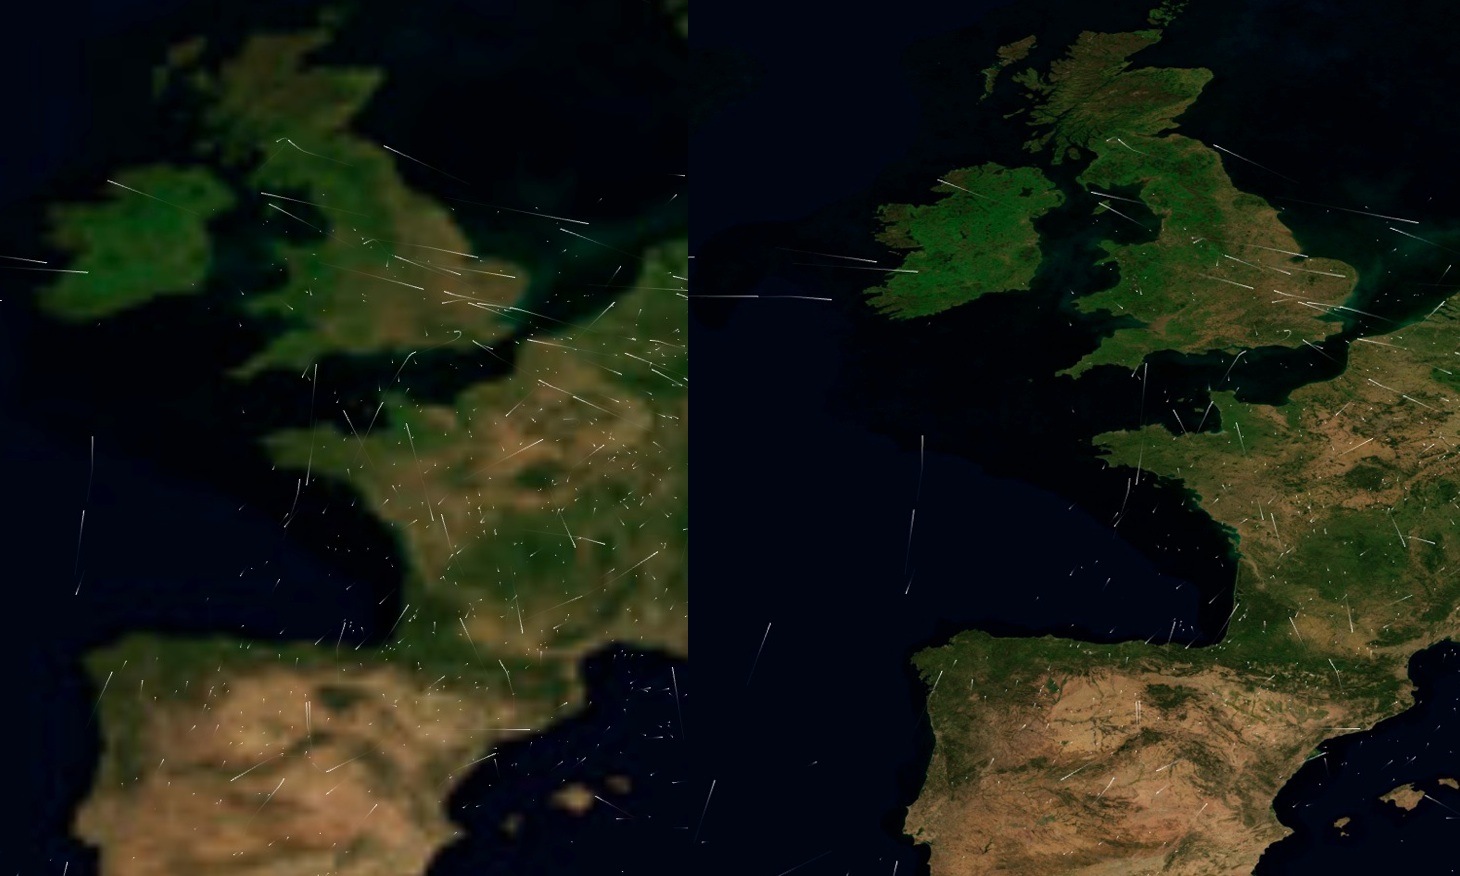
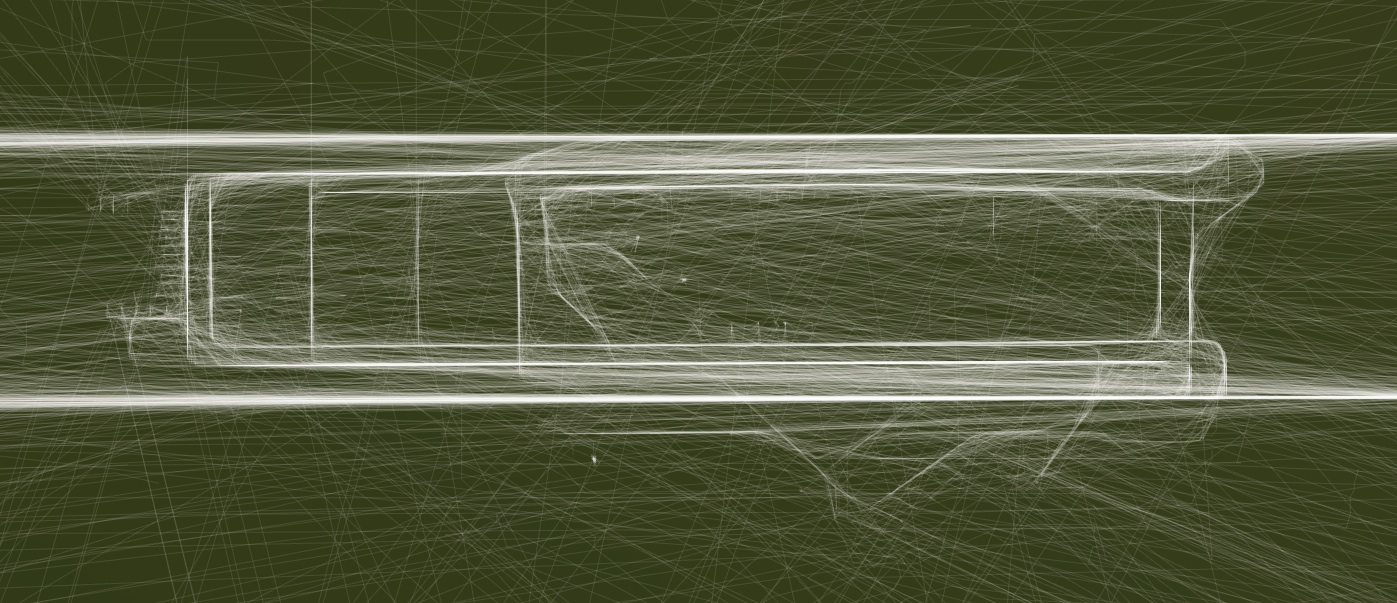
I've been working on an interactive version of the flight tracks viewer. It's still in a fairly early stage, but already can be quite interesting. it shows 24 hours of flights, with pretty full ocverage over the US and Europe, and partial coverage elsewhere. You can draw the map around with the mouse, and zoom in and out with the mouse wheel.

Works best in Chrome or Firefox. IE will require you add the "Chrome Frame" plugin from Google. Safari would need WebGL enabling.

Does not work on iOS, and probably not well on Android.

http://contrailscience.com/map/

(It can take a minute or so to load and process the flights)
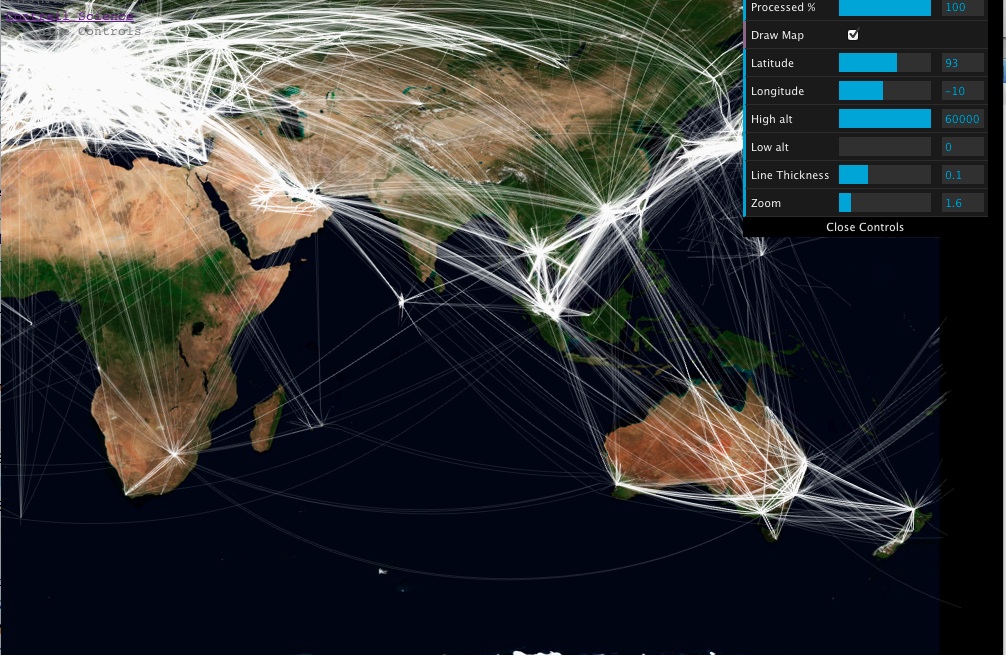
Screenshot:


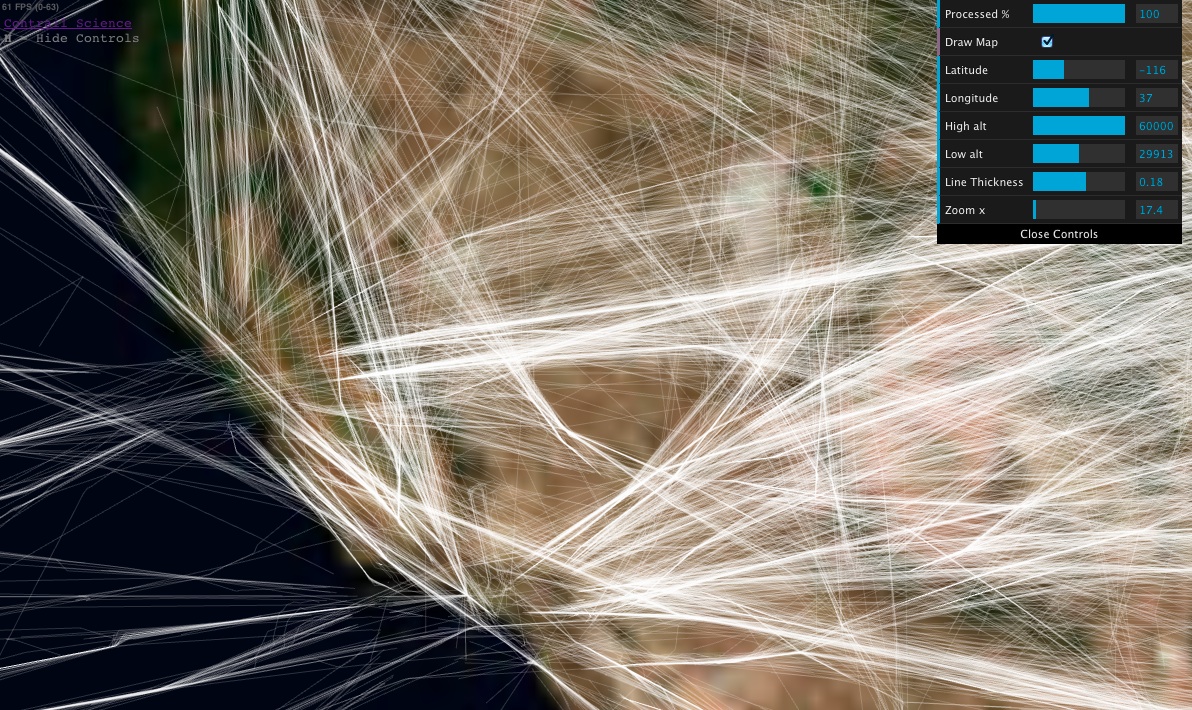
You can use the "High alt" and "Low alt" to filter the segments of the flights between certain altitudes (like, set "low alt" to around 30,000 to show only likely contrailing flights).

I'll be improving and extending it as I have the time, and I'll post here when there's significant updates.
 
Last edited:
Great work. Any chance it can depict great circle routes? Knowing how certain people can cherry pick data, I can see how the depiction of the Sydney Johannesburg route will confirm a few fallacies for them.
 
Great work. Any chance it can depict great circle routes? Knowing how certain people can cherry pick data, I can see how the depiction of the Sydney Johannesburg route will confirm a few fallacies for them.

Yes, I'm gradually transferring over the capabilities of the offline viewer, including drawing paths as great circles.

The long straight lines are from the ADS-B tracked transcontinental flights, where they just get tracked at the start and the end of their flights with nothing in the middle. I need to interpolate points to get great circles. Not incredibly difficulty, just a bit more fiddly to keep it in real time. I also need to get in the filtering out of spurious flight data, like the 0,0 stuff

I'm pretty sure I'll be able to get some nice real-time animation of the flights working soon.
 
Intersting, you can zoom in close enough to make out the basic shape of some terminals, based purely on the movements on the aircraft on the runways and taxiways, even pulling up to gates. This is LHR (London Heathrow).


The aspect ratio is a bit off as I'm using equirectangular projection for simplicity. I might switch to Mercator at some point, maybe toggleable. Here I've manually overlaid it:
 
Last edited:
Mick Is there a way to display info about individual flights like the carrier, flight no. etc? Like a mouseover or something

Not yet. But it's something I hope to have.

Overall it's an interesting programming problem, I started out with 3.5GB of raw data in JSON format. I reduced that to a binary format, about 72MB (although I could go higher resolution, about 250MB). This then gets loaded and displayed using WebGL, with custom shaders.

Web brosers are not well suited to displaying such large amounts of data, so I have to resord wherever possible to using the WebGL side to do things. There's basically no iterating over things on the JavaScript side, it's all in (fairly simple) shaders - which you can see in the page source.

Anyway, it's complicated, I can't just set 100,000 mouseover handlers :)
 
Thanks TWCobra!

I've added a clock to the latest version, so you can see what time things happened. Also added keyboard shortcuts.

TIP: animation is smoother in full screen mode (press F), or at least with the controls hidden (press H)
 
Brilliant. Imagine THAT integrated with stratospheric wind direction and humidity data. Not only the routes, but trails, to be compared with real-time satellite views.
 
Added an HD map option. It's off by default as it's rather resource intensive. But makes for nicer screenshots.

 
Last edited:
Really cool stuff Mick. As a programmer myself I am impressed - did you whip this all up yourself or are you using some libraries to handle the map for example? Also in regards to showing mouseovers, depending on how everything is constructed I see it as being possible. You could attach a mouseover handler to a flightpath only if we are within a certain Z threshold and the trail is longer is longer than a certain amount, and of course only to flights within the viewport. If that's not feasible, you could possibly have a list of flights within the viewport on the side and highlight the path on mouseover of those.
 
Really cool stuff Mick. As a programmer myself I am impressed - did you whip this all up yourself or are you using some libraries to handle the map for example? Also in regards to showing mouseovers, depending on how everything is constructed I see it as being possible. You could attach a mouseover handler to a flightpath only if we are within a certain Z threshold and the trail is longer is longer than a certain amount, and of course only to flights within the viewport. If that's not feasible, you could possibly have a list of flights within the viewport on the side and highlight the path on mouseover of those.

Thanks jvnk08. It's mostly my own work. I started out using the three.js library, but it proved to be two slow. So now it's pretty much raw WebGL stuff. The map is still three.js, but it's just a single polygon mesh that's manually scrolled and zoomed. I'm a programmer by trade. Here's another blog I write: http://cowboyprogramming.com/inner-product/

The problem is avoiding anything the requires iterating over the whole list every frame. There are 70,895 flights with a total of 4,255,861 data points (line segments). The approach I use for rendering is to render ALL the points, and filter them out shader-side, or with the Z=buffer. Even the "contrails" are done by drawing the entire track, and using a pixel shader to remove everything except the contrail.

So while picking seems like a simple problem, it's not simple to do it and keep up the frame rate. One could use highly structured data, like a BSP tree, or use more shader trickery, which is what I plan to try.
 
Bookmarked your blog, thanks. Game dev is where I got my start as well. I am continually impressed by the trickery and illusions used in games and other visual applications to produce the desired visual feedback.

I see the issue you're having and I wouldn't even know where to begin to solve such a thing myself. I'm a web dev, and though I started with game dev, 3D stuff typically goes right over my head. Looking forward to updates.
 
I just fixed a bug with this that was showing lots of slow moving flights. It was a problem with daily flights that shared the same flight number and straddled the 24 hour split time. It was treating two flights as one, and so you'd get a very slow segment linking what should be two separate flights around 20 hours apart. This was happening with about 8% of flights, so it's a lot cleaner now, although the "potential contrails" result is about the same. I was mistakenly only splitting flights if a plane "teleported" at high speed from one spot to another. Now I also split them if it "crawls" from one spot to another over 8+ hours. Slightly hacky, and I'll try to clean it up more later.
 
Back
Top