Explained: Exactly 5.55555556% (1/18) of votes for Trump across multiple precincts [Cherry Picked, Expected Ratios]

A friend posted this video of Mathematician Edward Solomon seeming to show that Trump won exactly 5.55555556% percent of the votes in multiple different precincts in Georgia during several reporting periods, suggesting that is probabilistically nearly impossible. If true, that does seem to be strange and concerning. Has anyone looked into this to debunk it? I'm at a loss for how to respond. Thanks! https://www.mediamatters.org/one-am...y-theory-computer-programs-changed-votes-2020

[Mod Additions]

2021-01-30_09-28-25.jpg

Article:
EDWARD SOLOMON: You could see that there's the first precinct there, it said 12:56 a.m. on November 4. And then when it abandons that ratio on its next tabulation update, two more precincts -- they inherit that ratio on the same time stamp. And then after they update their tabulations and abandoned that ratio of 1:18, another precinct inherits it.

BOBB: Solomon says that in order for the ratios to be that exact at clearly designated times computer software must have used an algorithm to change the votes. Specifically, for roughly 90 minutes at a time for rotating intervals, the precincts changed the votes to ensure that Donald Trump won only 5.555%, after the intervals completed, the precinct's returned to a normal vote count.

SOLOMON: It says that this could only have been done by an algorithm. It can't even be done by humans. So if you had a bunch of human beings that were trying to rig an election, and he said, 'hey, listen, I want you to give Trump 15% over here and I want you to give Trump 13.5% over here, and 5.5% over here,' even human beings trying to replicate this wouldn't get it this perfect.

BOBB: So what are the chances of this happening naturally? Solomon says that there are not enough stars in the universe to which you can compare.

SOLOMON: You can use the binomial probability formula, and the chance of that event happening is 1/10 to an exponent so large there's not enough stars in the universe -- there's not enough atoms in the universe to explain the number. It can't happen naturally.


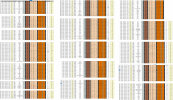
The link to "hundreds more examples" goes to the attached image. https://imgbb.com/m5YG58c
The link "See his investigative work here" goes to his YouTube channel: https://www.youtube.com/channel/UCIxc8YMkny2KBaD5TQsSbpg/videos
 

Attachments

  • Totally-Natural-Event-GA.png
    Totally-Natural-Event-GA.png
    1.7 MB · Views: 333
Last edited by a moderator:
The close-up example they show is:
2021-01-30_09-42-02.jpg

The ratio of 0.055555556 is just 1/18. In this spreadsheet it seems to be Ttot/Gtot (Trump total / G (grand?) total). In the first line we have 4/72, which is 1/18, then 10/180, 8/144, 5/90, etc. All equal to 1/18

HOWEVER, this does not seem to be evidence that "Joe Biden won exactly the same percentage points across multiple precincts at designated times of day long enough to change the advantage." It seems more like Solomon picking a number of times when some precincts had identical vote ratios - something that would inevitably happen with small numbers of votes. It's not 1/18 all the way, compare to the next block
2021-01-30_09-55-32.jpg
(First and second blocks shown)

Here the magic ratio is 0.04166666666, or 1/24 (4/94, 5/120, etc). The timestamps are different. So rather than there being "specific times", they seem to be RANDOM times. He simply went through a much larger set to data, looking for times when the ratio was a specific number.

Given that Folton and DeKalb counties only voted approximately 5% (varying by precinct, around 2-10%, say) for Trump, then these ratios will inevitably arise at various points in various precincts. Solomon has just cherry-picked them. There's nothing to show the distribution is anything other than what would be expected.

It's not clear where the actual data came from. Perhaps it's explained in one of his videos, but I don't feel inspired to watch them.

Solomon seems to be just picking the most common ratios, that's really all.
 
When you see a number like 0.05555555556, it's actually a "recurring decimal", meaning it keeps repeating forever.

The simplest example is 1/3, which is 0.33333333333333333333333333333333333333.... etc
2/3 is 0.66666666666666666666666666..... etc.

However, you'll see those written on a calculator as 0.33333333 and 0.66666667 - where the last digit is rounded up if it's a 5 or greater. This gives a number that's closest to the actual number, but it also has the illusion of being rather specific, with 5.55555556% looking like it's a 1 in 100,000,000 number, when it's actually just 1/18 (x100 to make it a percentage)
 
When you have a LARGE number of precincts (hundreds all over Georgia, I believe), and then pick a time early in the count when totals are small, you're going to get equal numbers with some probability.
It's like how it's hard to win the lottery, but someone usually does because you have so many players.

Statisticians know about the birthday paradox. This is about the number of people you need to have in room randomly to have even odds that two of them have the same birthday. Since the chance for exactly two people having the same birthday is only 1/365 , or 0.3%, you'd imagine you need a fair number of people, 100 or more, but it turns out you only need 23.

With the Georgia issue at hand, it's the same thing: we're seeing equal numbers that seem unlikely if you just picked two precincts at random, but if you're looking at equal numbers across all precincts (and don't nail down which number you're looking for), some will be equal just by random chance -- quite a few, in fact, since there are way more than 23 precincts.
 
Has anyone identified the 'mathematician' responsible for this? On searching for 'edward solomon mathematician' I got numerous results for Professor Edward I Solomon at Stanford, but he is a chemist, not a mathematician (though no doubt he is a better mathematician than I am), and in any case photos show he is not the guy in the OAN news video. The YouTube channel of the Edward Solomon responsible gives no information on his qualifications or affiliations. I did find one source which described him as a 'published mathematician with an emphasis on number theory'. He may be the same Edward Solomon who has written a self-published book (on the Scribd platform) claiming to have solved the Andrica Conjecture, an open problem in prime number theory (open unless, of course, he really has solved it.)
 
With the Georgia issue at hand, it's the same thing: we're seeing equal numbers that seem unlikely if you just picked two precincts at random, but if you're looking at equal numbers across all precincts (and don't nail down which number you're looking for), some will be equal just by random chance -- quite a few, in fact, since there are way more than 23 precincts.
There's 2,6522021-01-30_12-17-45.jpg
 
so basically this guy is trying to impress/confuse us with fancy math looking numbers.

basically a super small percentage of fulton county precincts were sometimes 1/18 (1 trump to 18 biden votes) at some point in the night.

pfft.
 
I randomly clicked in one of his 12 hour videos and found a bit of him looking for frequent ratios. He sets the spreadsheet up to count the frequency of each ratio, and it looks like it's sorted by ratio, so they all cluster together.

Source: https://youtu.be/Z7ObNvEPFvM?t=23970

2021-01-30_12-41-07.jpg
He sees one that's got a count of 6, and says "6, oh my god, what amazing ratio is this". He scrolls across and it's 1:3 (0.333333333). He goes quiet for a few seconds and says ".... is telling me not to use the 1:4 and the 1:3 ratios, because people will try to say those are, 'common ratios' even though that a precinct with 753 votes has the same amount of opportunity to get any other ratio around 1/3, including 1/3. We're going to keep it simple stupid, so the communists can't attack us"

He then sees that 1:2 (i.e both candidates get the same number of votes) gets 12 and starts to laugh and says:

"Google how many elections have ever ended in a tie in US history, and you will know this is bullshit"

This might be an interesting misconception to focus on. Looks like there's 900 results there (not election results, just partial precinct results. How many ties would be reasonable?
 
If they are literally counting just dozens of votes with each sample, then you'd expect some ratios to occur very frequently. It's not spooky, there really aren't that many fractions out there that you're likely to see at all, so some will occur very frequently. As Mick says, that's just cherry-picking. [minor edit - adding:] How many records are there in total - how big a pool did he have to cherry-pick from?

Imagine each record was one vote - you can guarantee that 0% and 100% would be *really* common ratios!

Is it possible to scatter-plot R-votes vs. D-votes, with marker size proportional to the number of hits for that coordinate, and preferably with different colours for (sub-)urban vs. rural districts, to see whether anything deviating from the completely predictable (given the underlying demographics known before election time) appears. Is there perl-script-readable raw data available (CSV would probably do)? I can see if I can still drive gnuplot...

This was the kind of bogomaths that drove me from some online chat hangouts in the direction of Metabunk - I was tired of having to disprove everything every time, and I felt sure that MB would be on top of things quicker than I could be.
 
most of these numbers aren't ties.
1612042338413.png


Article:
As the Wisconsin State Journal reported, the election for the Oregon Town Board chairperson is currently tied, 456-456. There is also a tie in the election for Mazomanie village president, 201-201.

...
According to “pure statistics,” the probability of the Oregon race resulting in a tie was 2.64 percent, he says. In the Mazomanie race, the probability was 3.98 percent. Those figures are the result of the binomial distribution.
That seemed extremely high to me. Indeed, he says, there is a big caveat.

“These ways of calculating probability assume that in an election, everybody has a 50-50 chance of voting for either candidate,” he says. “The real world isn’t like that. We’ve got folks on the left side, some on the right side, who aren’t as likely to vote for one of the candidates.”

Basically, the pure probability does not take into account the infinite number of variables
 
Last edited:
It's complicated because what happens isn't a bunch of coin tosses. There are different type of distributions.

In Georgia, there's precincts that are more 50:50, but also some that are more 90:10 or 10:90. Rural precincts favor Republicans, City precincts favor Democrats. The more even the overall ratio, the more likely a tie at some point (and, obviously, the most likely split for a partial count of the vote is going to be the same as the final count of the vote, if we ignore voting order, which calculates things more.)

Sadly the complication makes it a challenge to explain. Even just explaining why there are 12 ties in that dataset. Several of them are with very low numbers of votes (like, 2), so hardly surprising.

(and they are not all actually ties, just that Trump got half the votes, Biden + 3rd partys got the other half)
 
Here's a simplistic simulation:
Python:
from random import random
from random import randint

# farey function from: https://www.johndcook.com/blog/2010/10/20/best-rational-approximation/
# a float x, and a maximum vaue of denominator (bottom part of fraction)
# then returns a,b, such that a/b ~= x
# e.g. 0.333333, 100 will return 1/3
def farey(x, N):
    a, b = 0, 1
    c, d = 1, 1
    while (b <= N and d <= N):
        mediant = float(a+c)/(b+d)
        if x == mediant:
            if b + d <= N:
                return a+c, b+d
            elif d > b:
                return c, d
            else:
                return a, b
        elif x > mediant:
            a, b = a+c, b+d
        else:
            c, d = a+c, b+d

    if (b > N):
        return c, d
    else:
        return a, b

numPrecincts = 500
minSize = 100
maxSize = 200

minSpread = 3
maxSpread = 7

print
print(str(numPrecincts)+" precincts, with "+str(minSize)+" to "+str(maxSize)+" voters")
print("Candidate A getting between "+str(minSpread)+"% and "+str(maxSpread)+"% of the vote");
print("Top 10 most common ratios of Candidate A vote to total vote")

for i in range (0,1): # we run the simulation multiple times
    freq = {}
    for p in range(0, numPrecincts):
        size = randint(minSize,maxSize)
        votesA = randint(int(size*minSpread/100),int(size*maxSpread/100))

        votesB = size - votesA
        ratio = votesA / size;
        if (ratio in freq):
            freq[ratio] += 1
        else:
            freq[ratio] = 1

    s = sorted(freq, key=freq.get, reverse=True)
    for w in s[:10]:
        a,b = farey(w,1000)
        print(freq[w], str(a)+":"+str(b), w)
    print()

You can play with this code using an online Python compiler, which is really easy to do. Just copy and past the code into here:

https://www.programiz.com/python-programming/online-compiler/

Then hit RUN, you'll get output like:

Code:
500 precincts, with 100 to 200 voters
Candidate A getting between 3% and 7% of the vote
Top 10 most common ratios of Candidate A vote to total vote
8 1:25 0.04
7 1:18 0.05555555555555555
6 1:15 0.06666666666666667
5 1:21 0.047619047619047616
5 1:23 0.043478260869565216
5 1:20 0.05
5 1:28 0.03571428571428571
5 2:47 0.0425531914893617
5 1:17 0.058823529411764705
5 5:107 0.04672897196261682

So there I'm simulating 500 precincts with an unpopular candidate who gets from 3% to 7% of the vote in small precincts of 100 to 200 voters. You can edit the numbers to try different scenarios.

Note the second most common one was 1:18. This will vary each run, as it uses new random numbers. To get a idea of the more likely ratios, increase the number of precincts, say to five million.
Code:
5000000 precincts, with 100 to 200 voters
Candidate A getting between 3% and 7% of the vote
Top 10 most common ratios of Candidate A vote to total vote
51427 1:15 0.06666666666666667
46183 1:17 0.058823529411764705
44396 1:20 0.05
43170 1:18 0.05555555555555555
43013 1:16 0.0625
38051 1:21 0.047619047619047616
36896 1:19 0.05263157894736842
36758 1:25 0.04
35778 1:22 0.045454545454545456
30898 1:28 0.03571428571428571

Again, this is a simplification, as you'd need more information about distributions, but it should help the more numerically oriented get a better grasp on what is happening.
 
12 ties in 2652 precincts is 1 tie per 221 precincts, or (roughly) one tie per year the US exist. Ties in Georgia are less common than US presidential elections (there were only 59 so far)!
 
The main vehicle for manipulation here is the deliberate lack of comparison.
Nobody has any idea what these numbers should be, so it is easy to point at some and say, look how unusual these are.

A trustworthy analysis takes data from past elections and compares. What did the numbers look like in 2016? Was there any difference? If you don't do this, you're not comparing 2020 to "normal", you're comparing it to your imagination.

Generally speaking, that is a popular conspiracy theorist technique: to point incredulously at some numbers that have been taken out of context and lack meaning and a proper scale.
 
The main vehicle for manipulation here is the deliberate lack of comparison.
Nobody has any idea what these numbers should be, so it is easy to point at some and say, look how unusual these are.

Thank you for putting this so succinctly.

I am reminded of an episode of what may or may not have been /Penn & Teller's Bullshit/, where someone with a woo-woo-meter (probably flux, maybe bogons) walks around a "haunted" house, and at one point exclaims "it's reached 14.8!", with responses of "that's really high, there must be paranomal activity here". What are we measuring? Is that what you'd normally measure as you walk past a light fitting, or a distribution box on the other side of the wall? Don't just assert it's unusual, tell us the rules such that we can judge whether it's, and plenty of perfectly normal things are, unusual. (Justification for the rules can also be nice, but not always necessary to puncture a contentless argument.)

14.8 may not have been the actual number - please do not debunk me on that! :)
 
Back
Top