Calculations of Aircraft Contrail Formation Critical Temperatures (Mark L. Schrader)

CbIncus

Member
This post is about contrails formation and prediction of this phenomena.

The original paper by Schrader (http://journals.ametsoc.org/doi/abs/10.1175/1520-0450(1997)036<1725:COACFC>2.0.CO;2 - Calculations of Aircraft Contrail Formation Critical Temperatures) gives us tables of critical temperatures for different pressures, relative humidities and contrail factors. But it's only from 30 to 500 mb, lower levels are not included. The calculations are based on Goff-Gratch equation of saturation water vapor pressure. The provided source code and EXE file can help us to calculate Tcrit for any pressure level. The es​(T) function and des​/dT derivative are computed from Murphy-Koop formula, which is based on more recent data.

http://yadi.sk/d/hy75Iz934i-lO (Pascal source code)
http://yadi.sk/d/R0lQhzeE4i05K (EXE file)
 
I've accidentally posted Russian version of the program. The 2nd link above was changed to English one.
 
Thanks! I think that is a very important scientific paper for debunking the chemtrails on a day-b-day basis in areas close to a radiosonde station.

I used it to write a program to build these charts to help diagnose if contrails would form and if they would be persistent or not.

The explanation of the parts of the charts and what they mean is here.

I have pretty much abandoned that site and that work now.
 
Thanks Ross! Unfortunately there's no radiosonde station in Chisinau, Moldova, where I live. I'll try to use GFS Reanalysis-2 data to overcome this lack of measurements.
 
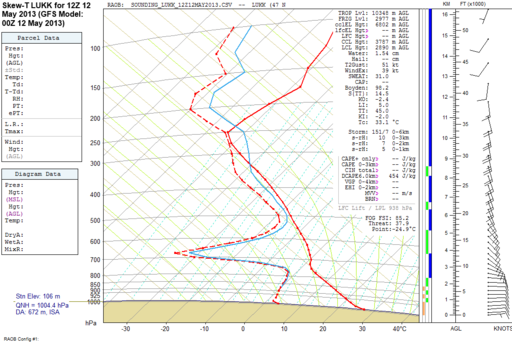
An example of contrail prediction using GFS Model data (00Z 12 May run) and RAOB sounding software. This is a forecast sounding for Chisinau Intl Airport (LUKK) for 12Z today. Some semi-persistent and one spreading contrail were observed over the city. The diagram below shows temperature (solid red line), dewpoint (dashed red line) and frostpoint (blue line). Where frostpoint is greater than temperature, ice supersaturation occurs and persistent and spreading contrails are possible. We see such a zone at 8,7-10,8 km AGL heights.

АД для LUKK на 12 СГВ 12.05.2013 (&#.PNG

There's a module for RAOB which allows direct plotting of contrail critical temperature: http://raob.com/mod_analytic.php.
 
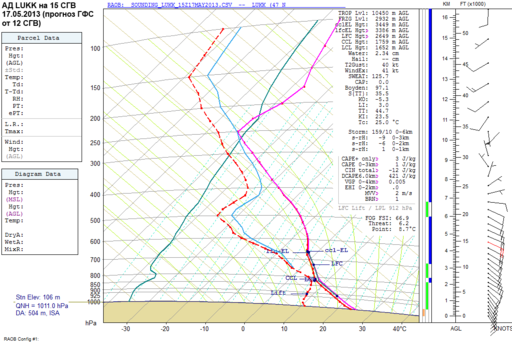
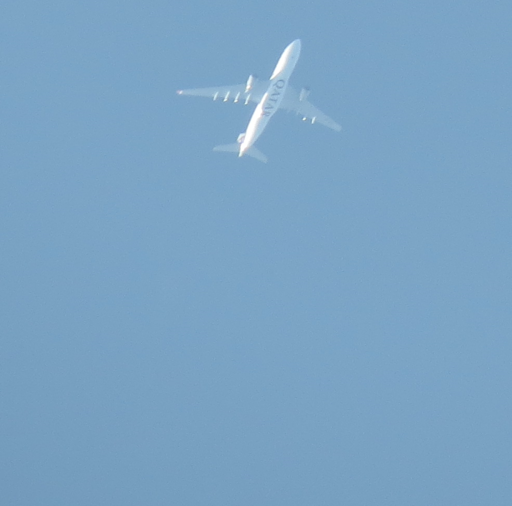
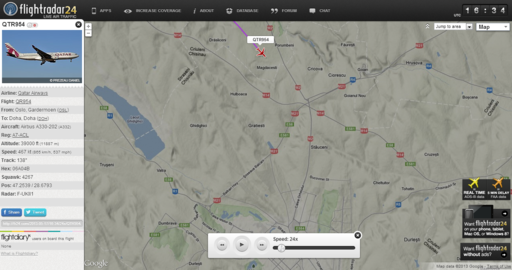
Another contrail prediction example for LUKK, 15 UTC 17.05.2013. I've bought the Analytical Module, so the contrail critical temp. is plotted along with frostpoint. There's a small region of contrail formation between FL340 and FL370, but no ice supersaturation occurs. I've observed some small contrails, and a plane with no contrail at all at FL390, which is well predicted.

АД по LUKK на 15 СГВ 17.05.2013 (п&#.PNG

QATAR Airbus A330 17.05.2013 (фото).png

QATAR Airbus A330 17.05.2013 (FlightRadar24).png
 
Thanks! I think that is a very important scientific paper for debunking the chemtrails on a day-b-day basis in areas close to a radiosonde station.

I used it to write a program to build these charts to help diagnose if contrails would form and if they would be persistent or not.
The explanation of the parts of the charts and what they mean is here.

Can someone that downloaded CbIncus EXE file and source code, post new links here since his links are offline?


Thanks!
 
Can someone ... post new links here since his links are offline?

Yes, those links are now broken. I am assuming "his" refers to me.
I can provide examples and an explanation if you want. I probably still have the text and diagrams that was used to build the pages that are no longer linked to.
 
Yes, those links are now broken. I am assuming "his" refers to me.
I can provide examples and an explanation if you want. I probably still have the text and diagrams that was used to build the pages that are no longer linked to.

Well actually by "his" i meant CbIncus' links:
http://yadi.sk/d/hy75Iz934i-lO (Pascal source code)
http://yadi.sk/d/R0lQhzeE4i05K (EXE file)
But since you had obtained them back then and wrote a program for your diagrams, perhaps you can give them or the relevant code anyway, here.

Thanks anyway.
 
But since you had obtained them back then and wrote a program for your diagrams, perhaps you can give them or the relevant code anyway, here.
No, I didn't obtain CbIncus' source code or EXE file.
You probably don't want to see my terrible Python code here.
 
Back
Top