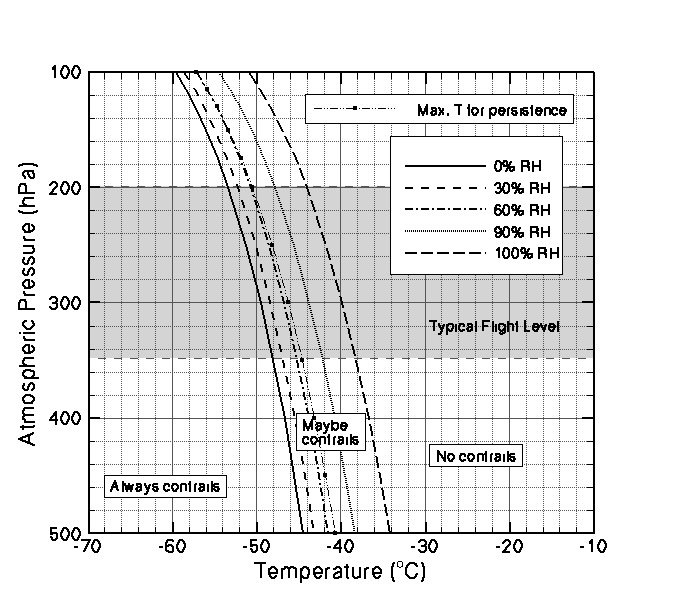
Contrails can
form at any level of RH, if it's cold enough. But if it's lower than a certain value, then they will not persist.
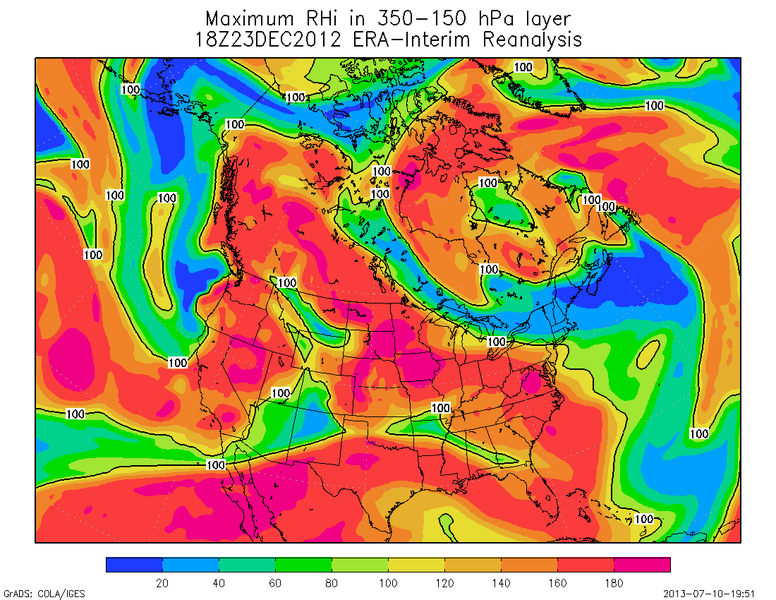
The 70% is a rule of thumb number for contrail persistence, and the real number varies with pressure (i.e. altitude). The numbers behind formation and persistence of contrails are actually a little complicated, as there are several variables involved. There's the temperature, pressure and relative humidity (RH) of the air, and the temperature, pressure, speed, and humidity of the exhaust gas.
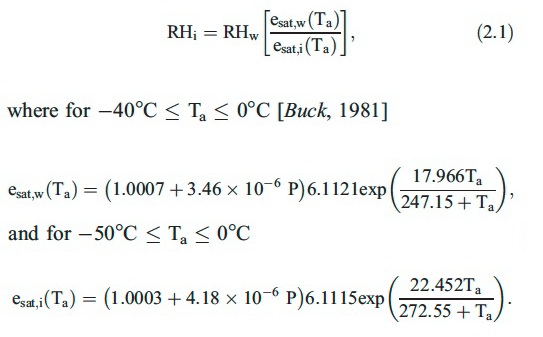
For a contrail to persist, the relative humidity with respect to ice (RHI) needs to be above 100%. Note the RH is not the same as RHI. It differs in the same way that dew point differs from frost point. It's also not a simple matter to convert from one to another, as they derive for different complex equations (polynomials), even the approximations of which (such as Goff-Gratch) are overly complex, so conversion is done with tables, or computers.
This link will give a taste of the complexity. Note that the equations given at the bottom of the page are approximations.
http://www.yesinc.com/education/moist-convert.html
Anyway, that's just to explain why there's not a precise figure. 70% is ABOUT the RH where RHI is above 100% in average contrail condition.
To answer your question: no, persistent contrail do not need higher humidity. If the RHI is above 100% (approximately 70% RH), then a contrail will persist. Contrails will fade away if the humidity is below this level. The dryer the air, the quicker they will fade away.

")