Looking for a map

MikeC

Closed Account
Somewhere in a thread on here we looked at the correlation between RHi & contrails & there was a series of maps posted mostly showing higher RHi around the equator - but I cant' find it now afte about an hour of searching :(

If this rings a bell with anyone can you point me at it?

Ta
 
Thanks, but no - I found that one.

The one I'm looking for had (IIRC) global maps, and most of the areas of high RHi were around the equator. It was part of a discussion of just how common RHi is, and so how often should persistent contrails form - the figure 1% of flights featured, or some similar low number.
 
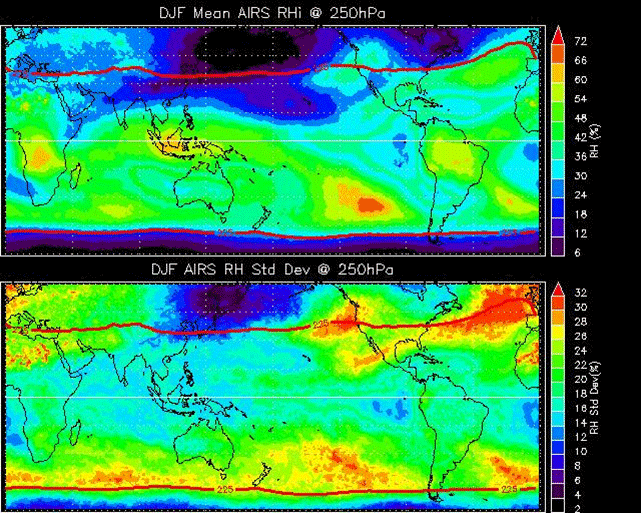
This image shows the mean RHi (top) and the mean standard deviation of RHi (bottom) at 250mb (about 34,000ft)

4784917f7e14aa536c2e6e3921a34b4a.gif


The RHi tends to be higher around the equator, but it is more variable across the southern latitudes and (especially) the North Atlantic.

Source: http://www.atmosp.physics.utoronto.ca/SPARC/Newsletter26/UTLS IGAC ws.html
 
Thanks, but no - I found that one.

The one I'm looking for had (IIRC) global maps, and most of the areas of high RHi were around the equator. It was part of a discussion of just how common RHi is, and so how often should persistent contrails form - the figure 1% of flights featured, or some similar low number.

TBH it does sound like you're talking about the MOZAIC project
 
Thanks - I just searched for that - not what I remembered tho....thanks for your efforts.
 
Colour I think - it was part of a discussion about how come there are so many persistent contrails if studies show that only about 1% (?) of the sky is supersaturated.
 
Colour I think - it was part of a discussion about how come there are so many persistent contrails if studies show that only about 1% (?) of the sky is supersaturated.

I thought it was about 16% of the time conditions were conducive for trailing.
 
Colour I think - it was part of a discussion about how come there are so many persistent contrails if studies show that only about 1% (?) of the sky is supersaturated.
Was it a map produced by NOAA or some other agency? Because NOAA and NASA have a wealth of information these days on their websites, and a lot of it is climate related data. And do you happen to remember what sensor the data was from?
 
I don't recall sorry - it was posted in a discussion here in the last 2-3 months about how persistent contrails should be rare since so little of the sky was supersaturated - that's about all I remember.
 
Back
Top