REPOST with fixed images and update:
I have found one more picture of these clouds (should have checked that
chemtrail site earlier

):
 https://www.facebook.com/photo.php?fbid=10205763981121435&set=p.10205763981121435&type=1&theater
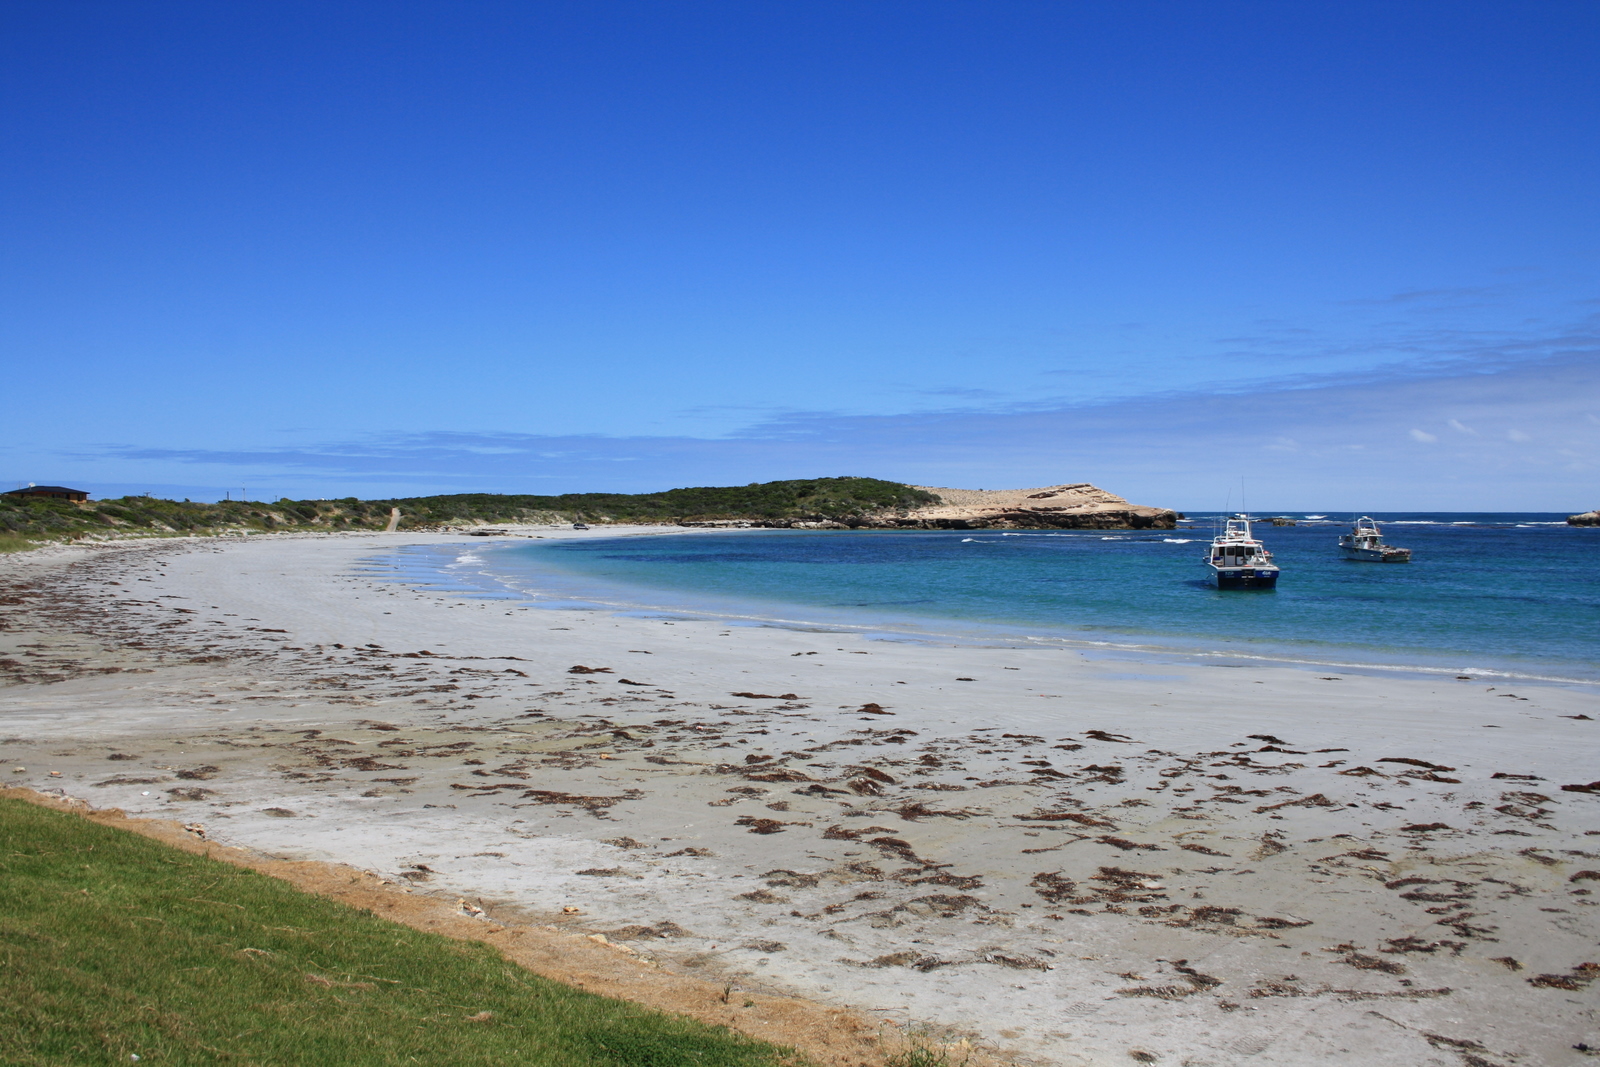
This photo has been taken at Port MacDonnell, about 20 miles from the location of OP photos in Carpenter Rocks and some 9 miles from the flickr photo location near Caveton. Using three different locations allows more accurate estimation of the cloud row position and orientation, therefore I have revised my analysis above.
I found approximate locations of all photos on Google StreetView. In the absence of prominent ground features, fitting photos to StreetView rather than directly to Google Earth resulted in probably more accurate viewing directions.


This analysis is made in the assumption of the clouds moving along the same line (orange). The altitude of this line is 5000 m (16,500 ft), that is, within the range for altocumulus clouds. A 4 km section of this line, the same in all fitted photos, is highlighted with a red bar; its length approximately corresponds to the average distance between the adjacent clouds in the row.
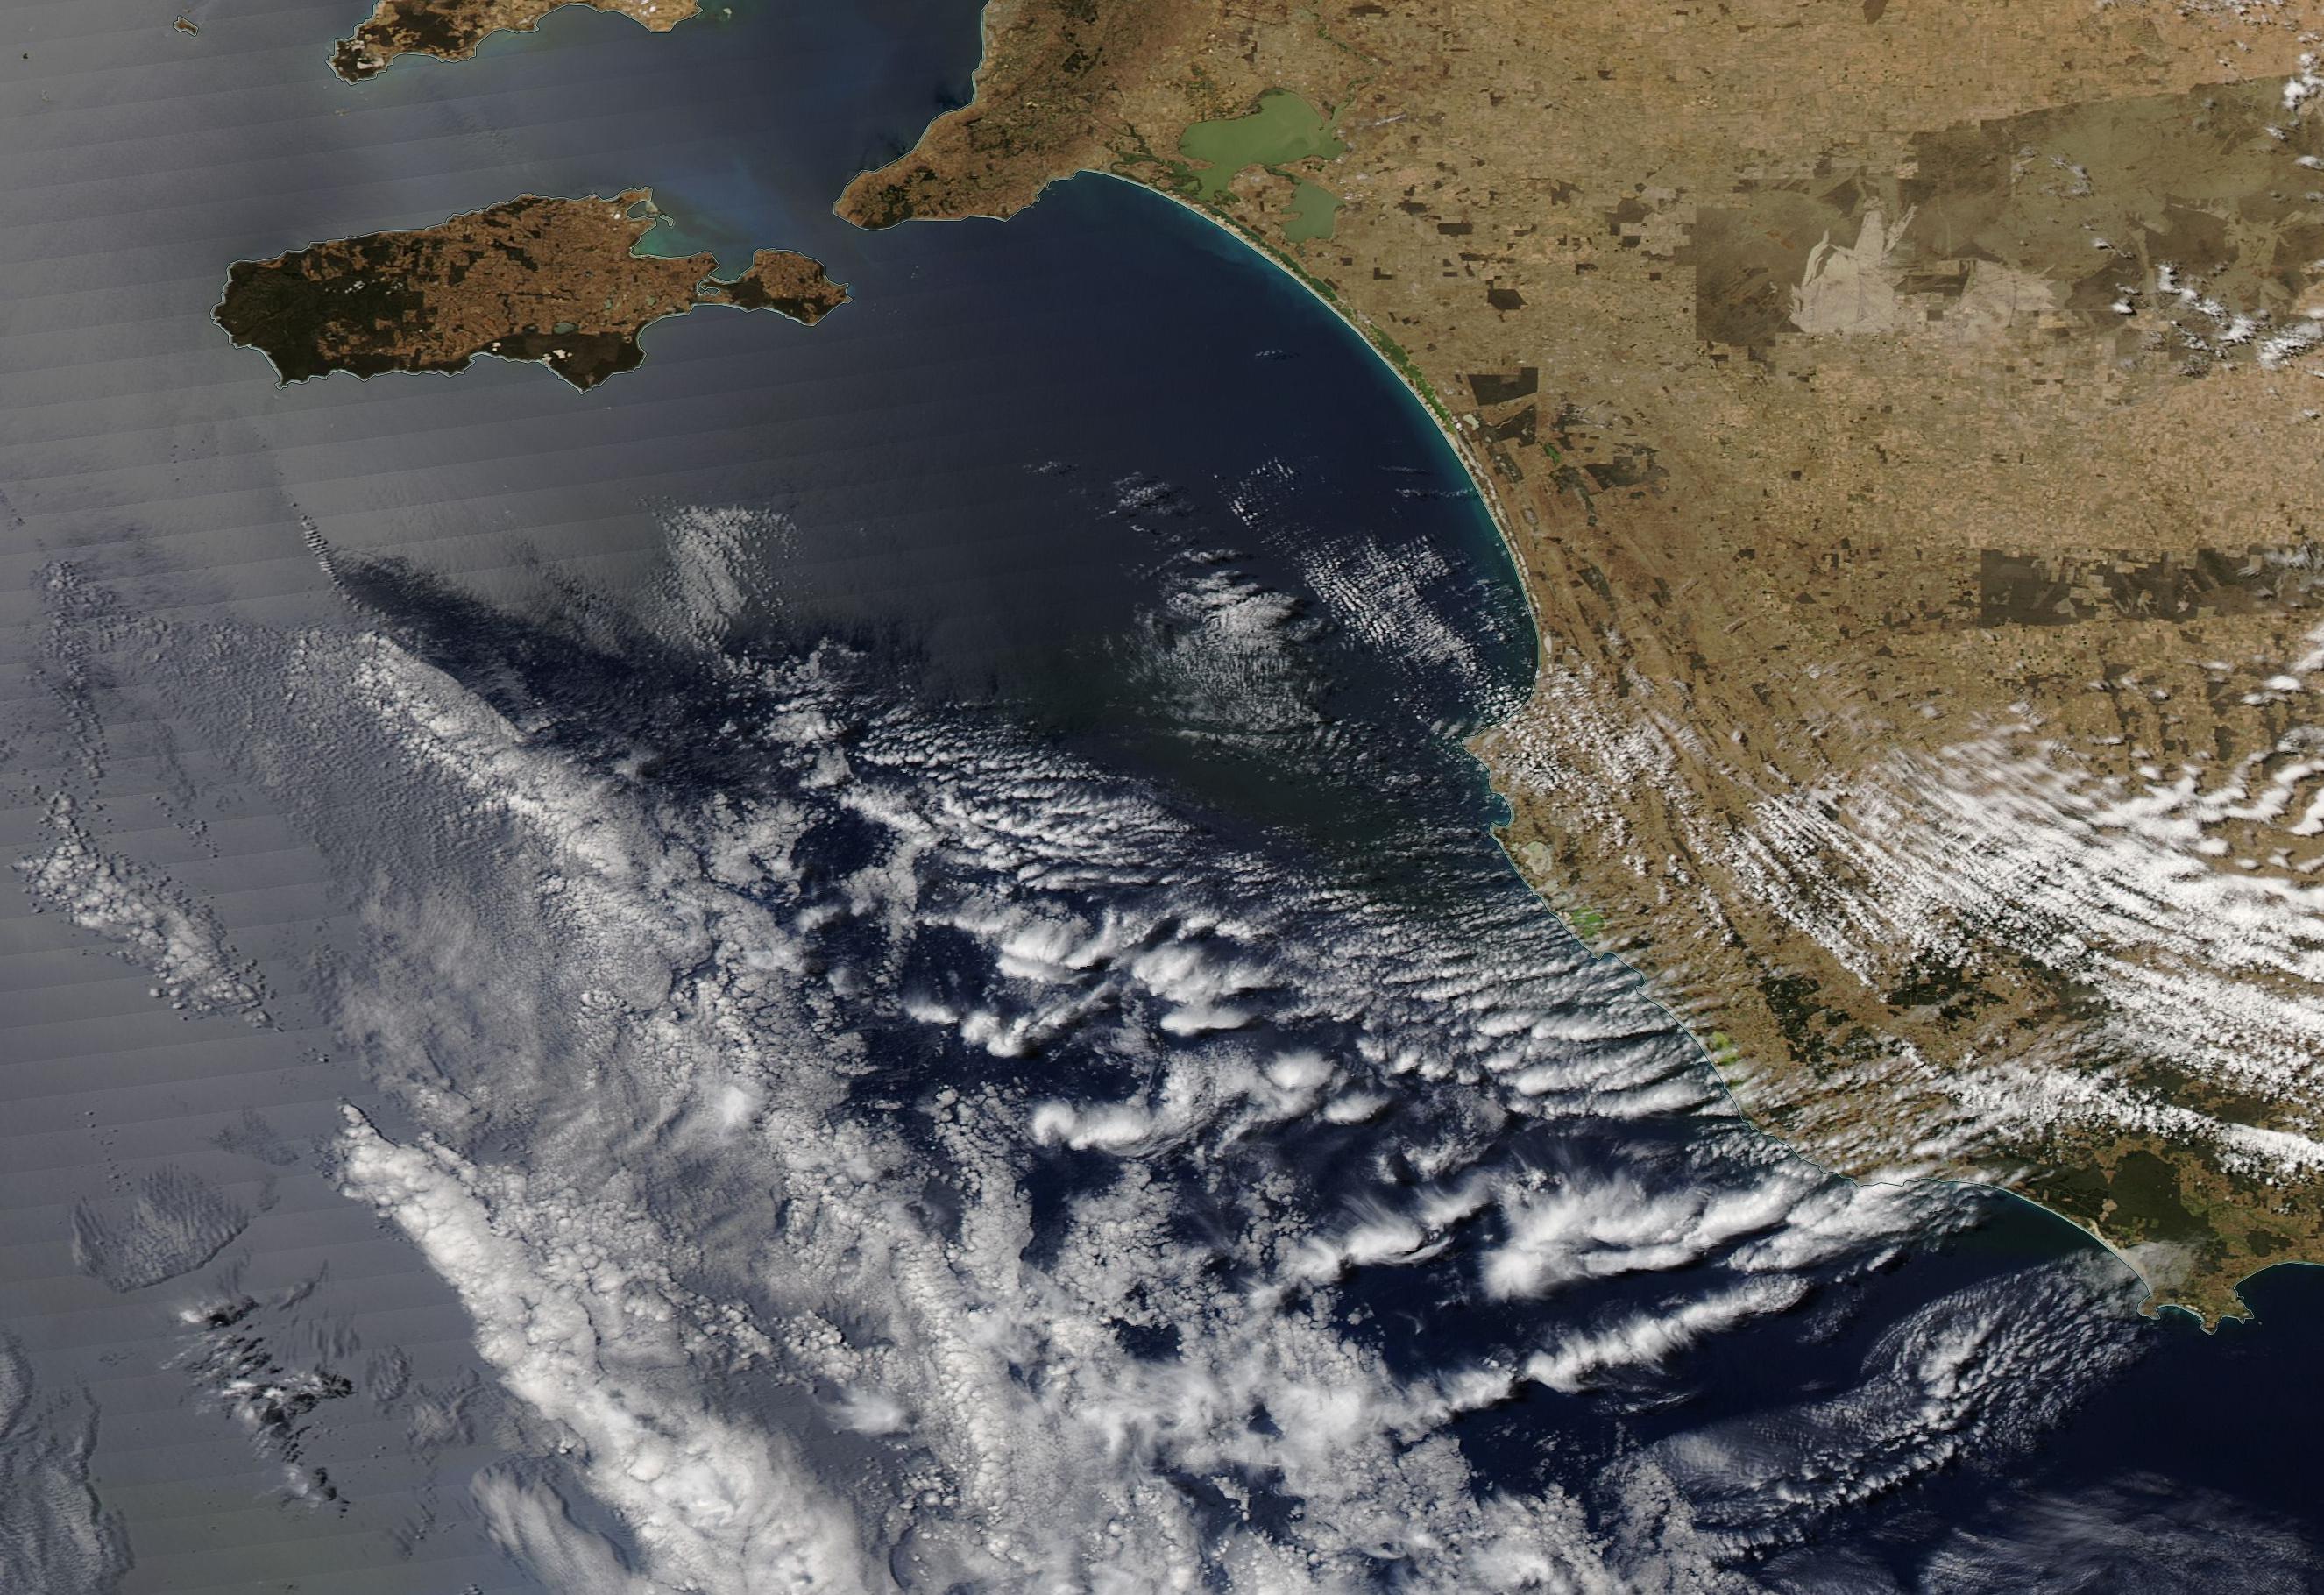
Compared to the earlier analysis, the line direction has changed by about 35° and do not coincide with the direction of linear cloud in the Aqua satellite image (taken about 5 hours earlier).

The new direction of 282° is very close to the wind direction (290°) at 500 hPa forecasted for that location at that time (
http://earth.nullschool.net/):

The predicted wind speed of 68 km/h is inconsistent with the claim that the OP pictures were taken with a 15 minute interval, as the clouds appeared to have moved by about 4 km along the line during that time. It is more likely that the actual interval was only about 5 minutes or less. Indeed, in the Port MacDonnell and Caveton photos, there are probably the same individual clouds that moved between the two photos (relative to the red bar) by about 16 km. For the predicted wind speed, the time interval between these two photos would be about 15 minutes, but for the speed estimated from the assumption of a 15-minute interval between the OP pictures, it would be about one hour. The former is consistent with the sunset colours of both pictures, the latter is far too long for them.
If there were precursors of these clouds five hours before the sunset, they would have to be some 300 km upwind. There are suitable clouds in
that location in the Aqua image (at the west end of the cloud system):

Although the revised direction of the cloud row goes along the Perth-Melbourne route, the row's estimated altitude is much lower than the average cruising altitude of commercial flights along this route. Therefore, the main conclusion of this analysis remains unchanged: this cloud row almost certainly "was purely meteorological in origin".
The KMZ file of the revised analysis is attached. Please ignore the fitting of the photos, it is not very accurate. The camera locations, however, are close approximations of the StreetView locations used in this analysis.
UPDATE
It appears to be a short row of jellyfish clouds compared to the
Seattle one, there appears to be the same six clouds in all images from the three different locations. The estimated length of this row is 20-25 km (about 15 miles). The
Caveton photo Exif suggests that it was zoomed in at focal distance of 60 mm. However, the camera lenses allow for a wider angle and could readily frame a longer row, if there were one.


