Historical Aerosol Thickness Debunks "Chemtrails are Geoengineering"

Jay Reynolds

Senior Member.
This may not be news, considering it was published in 2007.

The "Chemtrails are geoengineering" hypothesis says that geoengineering has been taking place in the form of aircraft placing aerosols of various substances in the atmosphere to ameliorate global warming by blocking sunlight.

If, in fact, such a geoengineering program were being implemented, such a program would result in an increase in aerosol density in the atmosphere.

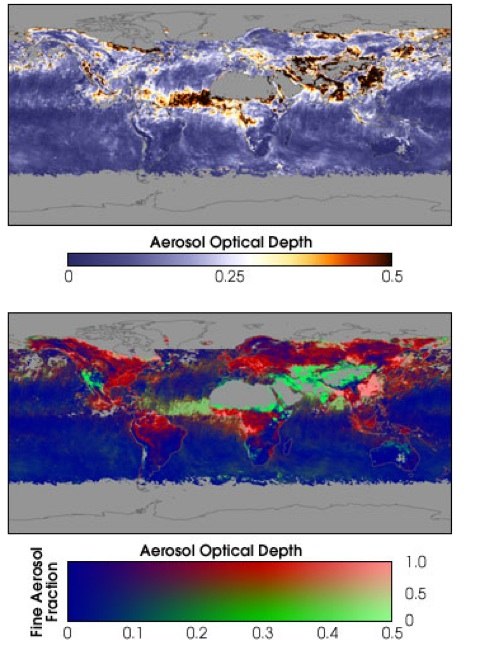
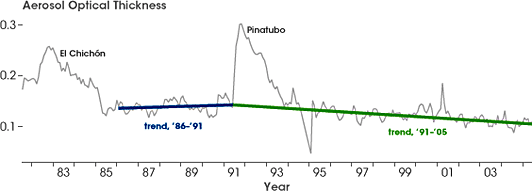
The facts show that earth's Global Aerosol Optical Thickness(AOT) has been decreasing during the time frame that the chemtrails hoax has been around, and specifically a downward trend has resulted in an AOT which has reached a 30 year low.
see:
Science 16 March 2007:
Vol. 315 no. 5818 p. 1543
DOI: 10.1126/science.1136709
Long-Term Satellite Record Reveals Likely Recent Aerosol Trend
Michael I. Mishchenko*, Igor V. Geogdzhayev, William B. Rossow, Brian Cairns, Barbara E. Carlson, Andrew A. Lacis, Li Liu and Larry D. Travis
http://cee.engr.ucdavis.edu/faculty/cappa/ECI289A_Fa07/Mishchenko2007.pdf

www.giss.nasa.gov_research_features_200711_temptracker_mishchenko_aerosol_532.gif
 
Last edited by a moderator:
I can see this being used to support a chaim that chemtrails are decreasing teh optical properties of the atmosphere - they're spraying something that is REMOVING aerosols...:rolleyes:

Can't you just see it...??!!
 
Very interesting! I once had beer with a Lambert.........
 
that Hawaii AOT plot should go straight to MJM, as it singlehandedly undermines his rationalisation for his constant flights out there in the name of journalism, ironically paid for by DVD sales to truthers.
 
Murphy seems to avoid addressing any questions, on the basis that the person asking them must be part of a disinformation campaign, and hence some kind of trick question. But now that Griffin is actually starting to questions things, then Murphy might find it harder to avoid it.
 
Try it, perhaps daily?

that Hawaii AOT plot should go straight to MJM, as it singlehandedly undermines his rationalisation for his constant flights out there in the name of journalism, ironically paid for by DVD sales to truthers.
After the Foodintegritynow interview, May 18th, I sent complete supportive documentation for all my remarks to the host, Carol Grieve, plus to Michael J. Murphy, G. Edward Griffin, and Francis Mangels. Mangels responded with some further questions, Griffin says he will respond in time, and MJM has made no response whatsoever.

Anyone should feel free to remind them of the facts, however, perhaps frequently, in their face, even.

I would be good for them to develop some kind of response, because it will eventually come up again given enough time. I discovered this years ago, and some chemmies have also known about it for years. None have come up with any substantive response. It does kill this particular element of the hoax succinctly and authoritatively with long-term published data.

It also shows that none of their 'scientists' are game to attempt to use common sense, logic, and factual data to test their hypotheses against what is already known, or else they did but didn't like the results!

Jay
 
If I were a hoaxer, I'd suggest that the clean air acts were so effective that the decrease in aerosols was warming the planet, and that the chemtrails have simply reduced the rate of the decrease
 
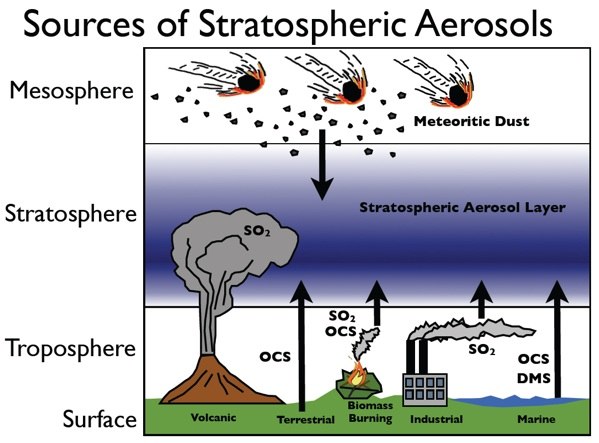
This new study from NOAA essentially reverses this debunk. While aerosols in general might be decreasing, stratospheric aerosols at least have actually increased since 2000:

http://www.noaanews.noaa.gov/stories2011/20110721_particles.html

The new study focused on the most recent decade, when the amount of aerosol in the stratosphere has been in something of a "background" state, lacking sharp upward spikes from very large volcanic eruptions. The authors analyzed measurements from several independent sources – satellites and several types of ground instruments – and found a definitive increase in stratospheric aerosol since 2000.
"Stratospheric aerosol increased surprisingly rapidly in that time, almost doubling during the decade," Daniel said. "The increase in aerosols since 2000 implies a cooling effect of about 0.1 watts per square meter – enough to offset some of the 0.28 watts per square meter warmingeffect from the carbon dioxide increase during that same period."

The reasons for the 10-year increase in stratospheric aerosols are not fully understood and are the subject of ongoing research, says coauthor Ryan Neely, with the University of Colorado and the Cooperative Institute for Research in Environmental Sciences (CIRES). Likely suspects are natural sources – smaller volcanic eruptions – and/or human activities, which could have emitted the sulfur-containing gases, such as sulfur dioxide, that react in the atmosphere to form reflective aerosol particles.

contrailscience.com_skitch_particlesfigure.jpg__1099__841__20110726_145940.jpg


The actual paper is "The Persistently Variable "Background" Stratospheric Aerosol Layer and Global Climate Change", which has this graph:

contrailscience.com_skitch_The_Persistently_Variable__E2_80_9Ce62bbb116264fe58aa5fb41ba8c0fb38.jpg


(Note the top graph is on a different time scale, and shows the two volcanic eruptions clearly)
 
Last edited:
contrailscience.com_skitch_both_20110726_160951.jpg


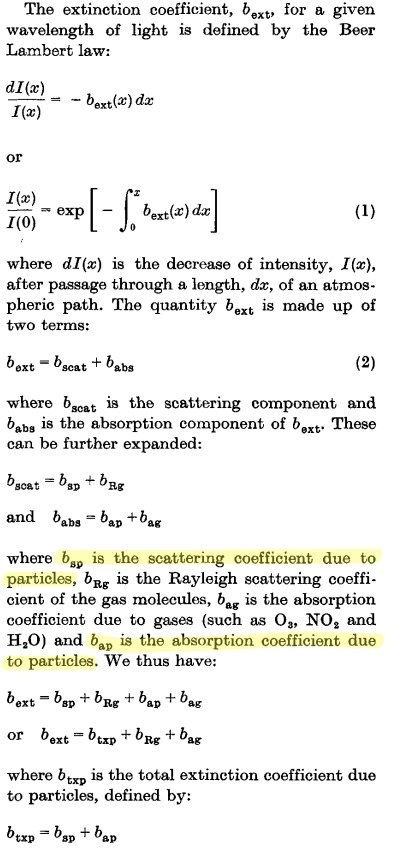
Here's the graphs overlaid for time. Optical Thickness and and Optical Depth are the same thing, it's the fraction of light that is blocked by a vertical column of the atmosphere. The smaller graph that shows the increase is different from the large graph in two major ways:

1) The scale is 0 to 0.020, whereas the other is 0 to 0.300 (15x the scale)
2) It's a measurement, by satellite, of aerosols ABOVE 49,000 feet (15km), whereas the other graph is a measure of the total aerosol down to sea level.
 
Last edited:
where does the "almost doubling in the decade" come from?

On the Global optical depth graph it looks like it's gone from about .005 to about .006-.007 - so about a 20-40% increase, with occasional measurements considerably above, but also a couple below.
 
Right - but that would then be a trend - one end point of which is above the actual value.

I use trends a lot here that do that - they often do not meet the actual end points, and I (my team) regularly disclaims the difference betwen the trend and actual values. I know you're just hte messenger, and it's only a part of the report, and maybe it is covered in the deep recesses of it somewhere.......but it's possibly a little bit of bunk for the pedantic...like me :)
 
No, I think "almost double" is an accurate characterization - in any system with noise you need to take the moving average, otherwise you could arbitrarily pick any random end-point, and get random results. After all, the trend is what we are interested in here. There's been an upwards trend in stratospheric aerosols over the last decade (and with weaker evidence, since 1960). It's not at all clear where this comes from. The volcanoes mess with observations, and the recent start with the satellite data make it look like this is something that just started around the same time as the chemtrail theory was created.

How to debunk such a connection? (and it will inevitably be made)? Two key points to make clear.

It's been going on since at least 1960, and that previous declines were due to volcanoes.
It's for aerosols above 49,000 feet. Total aerosols have still declined.

One can also use this to remind people that using regular air traffic is not a good way of putting things in the high stratosphere, as most air traffic is too low.
 
The graph of Global aerosol depth with a trend line in Mick's posting above show that Global Aerosol Depth (GAD- the total aerosol depth not just stratospheric aerosols) hasn't reached 50% of the post-Pinatubo level. The largest trend upwards is shown as peaks starting around 2005.

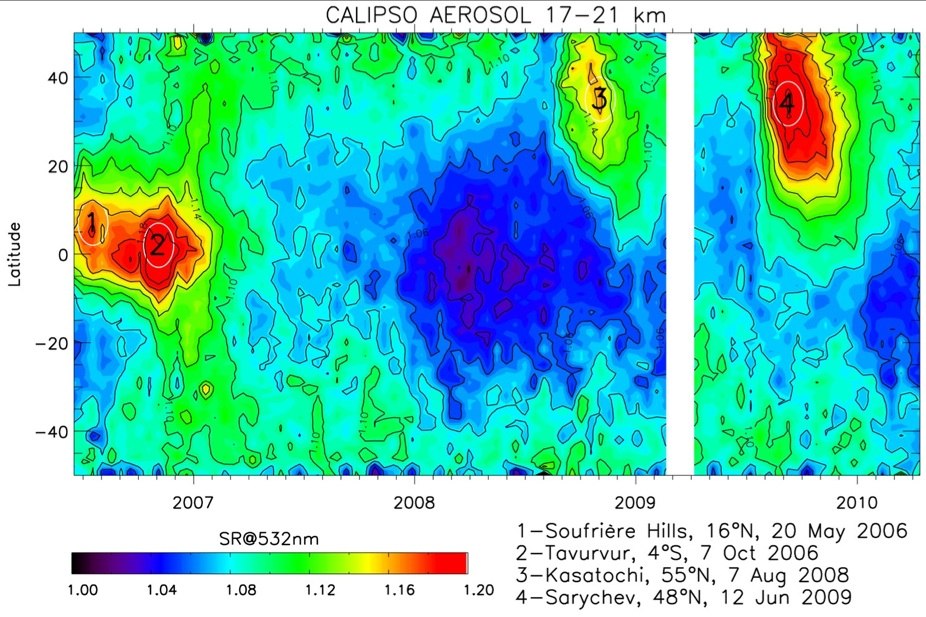
In the paper, Figure 1 shows the latitudes and years which were the sources of stratospheric aerosols which caused the peaks.

contrailscience.com_skitch_depthlatitudetime_20110729_085629.jpg


"Fig. 1. Evolution of the zonal mean scattering ratio at 532 nm
between 17-21 km from the CALIPSO lidar measurements
since June 2006. Plumes with scattering ratios greater than
1.15 that are observed in the tropics and at mid-latitudes are
linked to the indicated volcanic eruptions; after (16)."

The volcanoes are:
May 2006- Sufriere Hills located on the island of Montserrat in the Caribbean Lesser Antilles close to the equator

Oct 2006- Tarvurvur Crater at the Ravaul Volcano in Papua New Guinea close to the equator

August 2008- Kasatochi in the Alaska Aleutian Islands at a high latitude

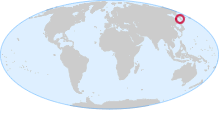
June 2009- Sarychev in the Russian Kuril Islands north of Japan at high latitudes

So, what the data shows is that rather than a generalized dispersed source of aerosols as would be expected if the aviation trails based geoengineering source of aerosols were occuring, four volcanic eruption plumes at specific locations are shown to be responsible for the peaks in GAD accounting for the bulk of the rise in GAD. These volcanic plumes are at speciic times and at locations far removed and not generally reported for "chemtrails"
 

Attachments

  • soufriere hills.gif
    soufriere hills.gif
    3.5 KB · Views: 1,357
  • location-map-ravaul-volcano.gif
    location-map-ravaul-volcano.gif
    3.5 KB · Views: 1,392
  • sarychev.gif
    sarychev.gif
    4.1 KB · Views: 1,371
  • kasatochi.jpg
    kasatochi.jpg
    3.6 KB · Views: 1,379
Last edited by a moderator:
Like you predicted here comes the CT views about aerosol thickness. This one from the guy in WITWATS in the form of a letter published in G. Edward Griffin's newsletter:
NOAA ADMITS PARTICLES IN THE ATMOSPHERE. CHEM-CLOUDS COMING FROM OFFSHORE
2011 Jul 28 from Dane Wigington
(This is in response to a report from the National Oceanic and Atmospheric Administration saying that global warming is diminishing because of an increase of particles in the upper atmosphere.)

The denial is beyond believe. They have no idea where all these aerosols could be coming from. Right! The NOAA, a branch of the US Department of Commerce, is only one more arm of the propaganda machine. Until "SAG" is exposed, (stratospheric aerosol geoengineering), the true state of the climate will continue to be masked from view. The entire planet, all that lives, will continue to be poisoned. Every breath we take will continue to contain toxic particles that do slow and insidious damage to our ourselves and our children.

As I have said too many times already, I can imagine no greater priority than to expose, and hopefully bring to a halt, the greatest single crime in human history. The total toxification of the entire globe, and the decimation of out atmosphere. I can only continue to hope that all will help carry this torch. That all will do everything they can to increase awareness in every way they can. Sending data to groups, organizations, and individuals, that would care, if they only knew.

Though the "in you face" trails seem to have dropped off, the silvery white skies are tell-tale signs of the aerosols. The satellite images from off the west coast make all too clear the massive spraying that is covering incomprehensibly large spans of sky over the oceans. All this blows in on us. Many evenings the sky is a filthy dirty tint, and strange upper level ripples of haze can be seen by those that care to look. The air quality and clarity is often bad enough that I can barely see Mt. Shasta only 45 miles + distant. The "experiment" seems to have changed in the last month or more, and the overhead bombardment diminished. Lately, the poisons simply drift in from the west. The damage being done has not stopped.

I hope all will consider the gravity of this most dire issue, and do everything possible to bring it to light.
 
I think from a debunking perspective, the most effective way of communicating why this is not evidence of contrails is to say it's simply a continuation of a trend that has been going on since the 1960s. From the paper:

High quality ongoing measurements of stratospheric aerosols using lidars or balloons have been carried out at a limited number of sites around the world, and records extend back to the 1970s in some locations. The input and decay of material from major volcanic eruptions is readily observed but changes in the underlying "background" have also been noted. Hofmann and coworkers (12–14) argued that the"background" stratospheric aerosol layer increased by 5-9%/year through the 1960s, 1970s, and 1980s, and again at about 5-7% in the 2000s. However, in the 1990s stratospheric aerosols decreased by similar magnitudes. Other authors (15)recently noted the likely importance of volcanoes, suggesting that changes in the "background" were variable, and that trends were sensitive to the time interval considered.


So not only is this a 50 year trend, it's actually been increasing slightly slower relative to decades ago, as it was 5-9% in 1960s-1980, and 5-7% in 2000s.

And given that the background level declined in the 1990s, then if the chemtrailers want to use this as evidence, it must be evidence that chemtrailing went on heavily in the 1960s-1980s, stopped in the 1990s, then resumed in the 2000s.

The very title of the paper is something of a debunk. "The Persistently Variable "Background" Stratospheric Aerosol Layer and Global Climate Change". - So the Stratospheric Aerosol Layer is persistently variable, hence you'd expect it to be changing. So this is nothing at all unusual.
 
The other big disconnect that Wigington, et al, have not recognised is that this latest news (and the whole "stratospheric aerosol engineering" idea) concerns the stratosphere, and not just the lower part - right up in the guts of it, and the trails they all point to are clearly in the troposphere.

Der!

When I read this part "The satellite images from off the west coast make all too clear the massive spraying that is covering incomprehensibly large spans of sky over the oceans." I thought, he is referring to one of dutchsince's recent nonsensical videos.. http://www.youtube.com/watch?v=M4s_60XeB1Q ... I think those are ship trails.

*shakes head*
Exactly, Ross. For reference, the Stratospheric Aerosol Layer is also known as the Junge Layer, discovered in the 1960's.

http://www.albany.edu/faculty/rgk/atm101/junge.htm

The Calipso data map in Image 1 is at 17-21 km, 55,000 to 68,000 ft altitude.

And yes, those are ship trails, they persisted for several days in linear form indicating they were within the stable marine boundary layer a few thousand feet above sea level. Hardly something that was in the stratosphere.
 
And when Wigington says:

Every breath we take will continue to contain toxic particles that do slow and insidious damage to our ourselves and our children.

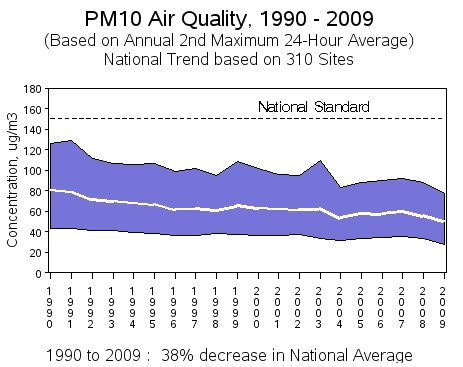
He's forgetting that the ground level air quality has actually somewhat improved over the past 20 years, especially with man-made particulates.

http://www.epa.gov/airtrends/pm.html

contrailscience.com_skitch_Particulate_Matter___AirTrends___Aif50daaa301a052e5d310ce37faf215a1.jpg


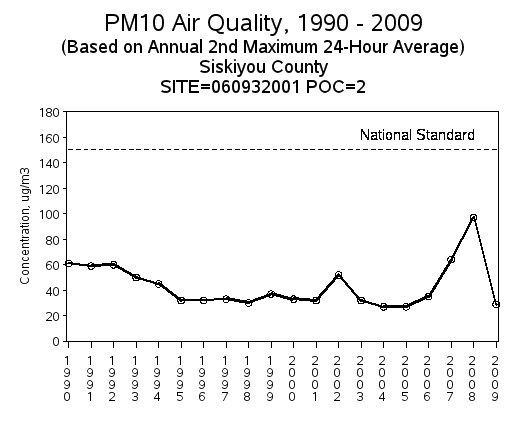
And local to Wigington in Siskiyou county:

contrailscience.com_skitch_Particulate_Matter___AirTrends___Ai40ea3cb6baf9a528e0ae3262e5686682.jpg

Shows the same trends, but with a local peak in 2007-2008, probably due to the large amount of fires.

http://en.wikipedia.org/wiki/California_fires#2000s
 
Last edited:
In 1998, Edward Teller proposed Stratospheric Radiation Management (SRM)" in his article "A Sunscreen For Planet Earth:
http://www.evolutionquebec.com/site/archives/teller.htm

He looked at the result of the Mt. Pinatubo eruption in 1992 and saw that it cooled the planet by ejecting 20 million tons of sulfur dioxide into the atmosphere, and proposed that humans could do the same to cool the planet.

Chemtrail conspiracy theorists have been claiming that persistent contrails are evidence of SRM.

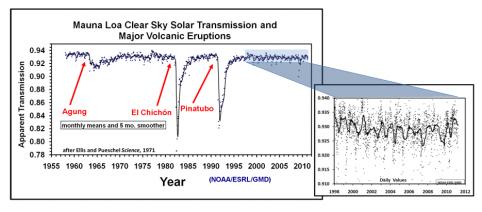
If SRM were taking place, it would be evident in atmospheric readings of the transmission of solar radiation through the atmosphere, some of it would be blocked and transmission would decrease as it had during past eruptions.
If SRM were taking place, transmission would decrease.

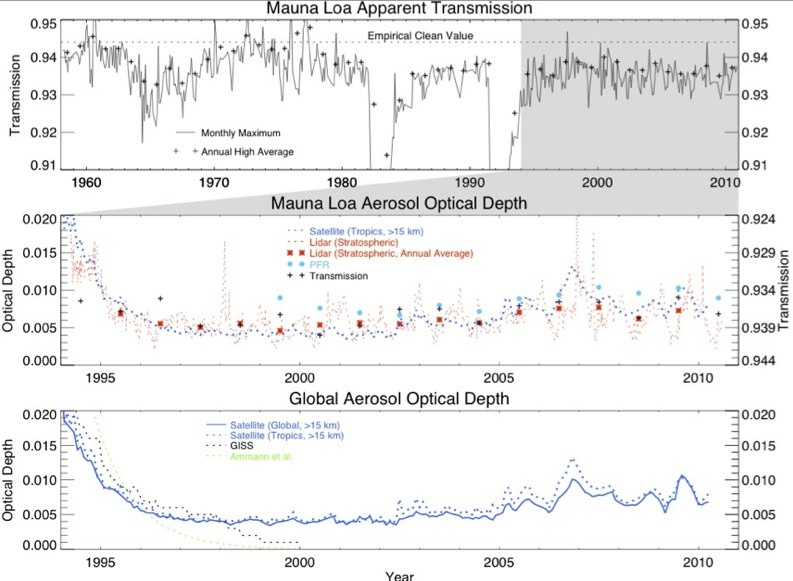
Here is a graph of such transmission:

mauna loa2.jpg

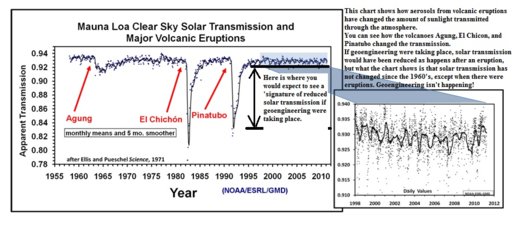
Note the effect of Pinatubo, and also note that no such change has occurred. Indeed, the transmission levels are no different than ordinary background levels since 1955. This disproves, probably more than anything else, the claim that SRM has been taking place.
 
I was told that many people don't understand the point I was making with the above graphic, so I've added some explanation for clarity.

mauna loa3.jpg
 
Vigorous debate is good. It forces the debaters to carefully evaluate their positions and, if honest debate is sustained, to re-evaluate their positions, conceding points well made. It encourages analytical thinking and fact gathering such that both serve to bring about truth. If only the promoters of chemtrails would engage in an honest debate, the issue would be much further along towards a resolution than it is.

In the spirit of debate, my conclusions in this thread were well challenged by GeorgeB in another thread here.

GeorgeB's contention as a "chemtrails advocate", laid out here, is that a covert aerosol program could be ongoing if certain assumptions are made, though he has no direct evidence for it. My position is that the data, specifically solar transmission measurements, do not show the solar transmission decreases which would be expected if such a program were underway. My position is laid out above in this thread.

As a result of George's counterclaim in the other thread, I must admit that, even though it is not clear to me in the graph I posted above, some data in this paper does show that solar transmission declined between 2000 and 2009, which the paper does attribute to sulfur releases from coal burning increases by the world's largest CO2 emitter, China, and another paper says were also likely due to smaller volcanic eruptions.

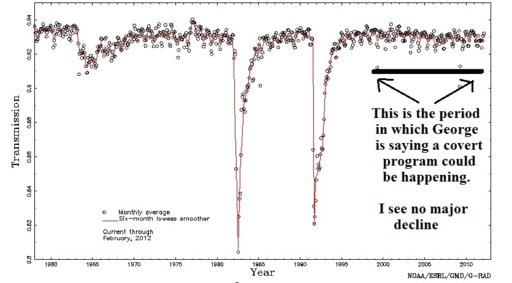
I was confounded, yet determined to learn more about the facts of the matter. I did further research, first looking at the Mauna Loa website at the most recent transmission data here:
mauna Loa 2-2012.jpg

To me, this data doesn't show a clear decline, which is probably due to the long-term nature of the 50 year representation. The data is "time sensitive" to a negative degree. For example, consider you were on a road trip through the mountains, and at the end calculated your average speed at 40 miles/hour. In actuality, however, during parts of the trip you were headed uphill and your speed might have decreased, and at times headed downhill at much greater speed.

What was needed is a greater resolution, and I believe I have found it. One month before last, in July 2012, the Bulletin of the American Meteorological Society (BAMS) produced The State of the Climate in 2011, containing the most recent review of climate data available. Here is the section on solar atmospheric transmission:

BAMS said:
SIDEBAR 2.3: LONG-TERM CHANGES OF ATMOSPHERIC SOLAR
TRANSMISSION—E. DUTTON
Both the solar and thermal infrared transmission of the atmosphere play important roles in Earth's energy balance. For example, the anticipated long-term worldwide decrease in infrared atmospheric transmission, due to increasing greenhouse gas abundance, gives rise to the issues and concerns of global warming. Similarly, long-term increases in the solar transmission would contribute to warming, while a decrease would have the opposite effect. While considerable attention and effort has gone into observations necessary to track and understand the long-term global background of the atmospheric infrared transmission, relatively few similar records of the solar transmission exist.
One of the longest, continuous observational records of solar transmission through the free troposphere and above is maintained by NOAA at the Mauna Loa observatory in Hawaii (Dutton and Bodhaine 2001). This consists of qualified daily and monthly averages of clear-sky morning "apparent" solar transmission obtained from pyrheliometer observations by the methodology first described by Ellis and Pueschel (1971). The "apparent" is an optical term applied to the solar transmission values used here because they are determined from ratios of direct beam solar irradiances observed at different solar zenith angles (atmospheric paths) such that the computed transmission is relative to the irradiance already transmitted along the shorter path. The irradiance is measured with a calibrated pyrheliometer. The linear calibration factor cancels out in the apparent transmission ratio, yielding a more accurate and stable result.
This measure of solar transmission is particularly sensitive to aerosols. The computational procedure diminishes the effect of water vapor, which is the other major contributor to variable clear-sky solar transmission, due to saturation effects. There is also a minor ozone contribution, although this is not significant on the scale of the variations seen. Spectral aerosol optical depth is also observed (sun photometer) at the site and confirms the primary aerosol role in current observed solar transmission variability. Although only a single site, Mauna Loa can be considered representative of a much larger portion of the Earth because of its remote central Pacific location and high elevation, above most local effects, especially in the early morning during downslope-wind conditions when daily transmission measurements are made.
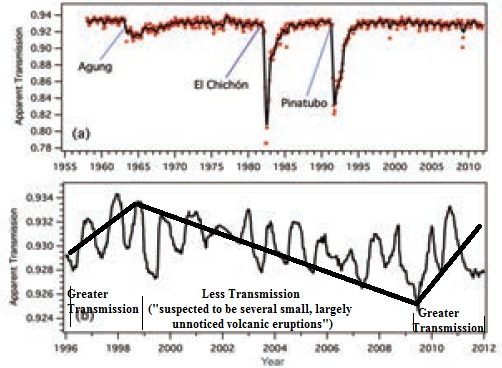
The complete apparent transmission (AT) record (Fig. SB2.7a) shows the extended impact of three major explosive volcanic eruptions (Agung, 1964; El Chichón, 1982; and Pinatubo, 1991). These injected large quantities of sulfur dioxide (SO2) into the stratosphere, where it was converted to sulfate aerosol and remained for many months while spreading around the world. A certain amount of month-to-month variability and a small amplitude (~0.007 AT) annual cycle (spring minimum, winter maximum) persisting throughout much of the record are also seen. This annual cycle has been attributed to the seasonally
enhanced transport of Asian tropospheric aerosol over the site (Bodhaine et al. 1981). Not so apparent in the record are potential variations in the overall background transmission, which have the most enduring effects. Examination of the last decade (Fig. SB2.7b) and other information by Solomon et al. (2011) has shown a small net downward tendency, possibly due to multiple periods of injection of stratospheric aerosols. Figure S2.7b suggests a general decrease of about 0.003 AT occurring between 1998 and 2010. This trend is also seen in collocated spectral aerosol optical depth measurements. However, the downturn appears to have ended in the last 2–3 years. Currently, it is not possible to discern a continuing coherent long-term behavior in the record, but the 55-year AT record permits putting the current variability into historical context.
Using these and other data, Solomon et al. (2011) computed that the decline in transmission (or equivalently, an increase in AOD) from the late 1990s to 2010 was sufficient to reduce tropospheric warming by about 0.07°C compared to a scenario with a relatively "clean" stratosphere, as was previously widely used in global climate models for that decade. The source of the general decrease in solar transmission is suspected to be several small, largely unnoticed, volcanic eruptions that together have increased the stratospheric component of the total column aerosol over a large portion of the globe (Vernier et al. 2011).
The graph, which includes my previously referenced Mauna Loa Clear-sky solar transmission (a), also shows a high resolution version covering the more recent period (b).
State of Transmission.jpg

Using this higher resolution dataset, you can now discern that solar transmission has gone through a complete cycle from greater to less, and during the past three years is basically back where it started. There is corroborating data in the colored CALIPSO aerosol chart above showing good reason to suspect the volcanoes were the source of decreased transmission through 2009, but that effect has now gone away and transmission has returned to the same state it was in at the time George claims that geoengineering was taking place.

This data shows that though some changes in optical transmission have occurred during the decade in which claims have been made that there was ongoing geoengineering, that trend has reversed and transmission has since recovered to its previous state.

It is significant that during the time of the last three years, as solar transmission has recovered after being perturbed by the volcanoes, this recovery occurred amidst an unabated continuation of the same "chemtrails" being reported worldwide. Thus, there is no correlation seen between the observation of purported geoengineering "chemtrails" and any decline in solar transmission.
 
Last edited by a moderator:
Jay, In response to your response above . . .

1) Persistent Trails in the sky due to increased air traffic, increased cruising altitudes, and more efficient jet engines do not equate to ICAAIP . . . ICAAIP is IMO most likely stratospheric injection of sulfur compounds . . . persistent trails . . . many of which are in the higher Troposphere have more local effects as in narrowing (DTR) Diurnal Temperature Range . . . not significantly reducing Solar Transmission or increasing Aerosol Optical Depth . . .

http://meridian.aag.org/callforpapers/program/AbstractDetail.cfm?AbstractID=37854
.
2) A well managed ICAAIP would use a measured response to feed back from both public and classified atmospheric data . . . the managers would be seeking to nudge the planet in the right direction without exceeding aerosol concentrations that would be so high and so quick as to be obvious manipulation or so over reaching as to cause unexpected side effects . . .


3) Though China's coal burning and little recognized volcanic sources (primarily tropospheric) are mentioned as possible causes for the Transmission reductions until 2009 . . . other anthropomorphic causes were never eliminated . . . one of which could be stratospheric injection . . . which is by-the-way easy to turn down or On/Off . . . funny you are not suggesting China has suddenly reduced its economy or tropospheric pollution . . .you are simply implying . . . the increase or stabilization in Transmission since 2009 is due solely to the variability of background scatter on a more or less ten year cycle and possible clearing of the little known volcanic activity . . . which you emphasized by adding the trend lines on the supplied altered graphs . . .


4) Since Solar Maximum potential (concerns see below) has changed drastically over the decade starting in 2000 and culminating in the recent findings in 2011 . . . it . . . along with increased sulfur injection estimates from emerging nations such as China may have convinced authorities to slow down or cease operation in the last two-three years . . . and along with other cyclic events and historical variable background noise the result is a recent increase in Transmission of Direct Solar Radiation at Mauna Loa, Hawaii

External Quote:

http://wattsupwiththat.com/2011/06/...ding-spots-signal-big-drop-in-solar-activity/


"Currently, the sun is in the midst of the period designated as Cycle 24 and is ramping up toward the cycle's period of maximum activity. However, the recent findings indicate that the activity in the next 11-year solar cycle, Cycle 25, could be greatly reduced. In fact, some scientists are questioning whether this drop in activity could lead to a second Maunder Minimum, which was a 70-year period from 1645 to 1715 when the sun showed virtually no sunspots."
 
George, I'm not implying anything. The data speaks for itself.

Chemtrails people say that geoengineering is to dim the sun, that it is an ongoing, ever-increasing program every day and night, "poisoning the world with mountains of metal".

The claims are not that chemtrail activity has slowed in any respect.

Didn't you watch "Why In The World Are They Spraying?"

Chemtrails advocates are calling for violent action, looking for heat seeking missiles and threatening to kill pilots. The rhetoric of your peers has not abated even though solar transmission has increased, exposing all the false geoengineering chemtrail claims.

However, the data does not support the idea of such a geoengineering progam being underway.

The data says otherwise.

Isn't it about time for you to admit that, and join us in exposing this hoax?
There isn't much more we can do here for you, George, if you aren't part of the solution, you remain part of the problem.

The choice is yours.
1) No I didn't watch the video . . . I think I may have seen some short clips from it . . . I avoid all chemtrail videos and websites as much as possible . . . I have since I started investigating the science behind the concept over three years ago when I first heard the term . . .
2) Chemtrail advocates will always be around . . . a few may be influenced by debunking but IMO most won't . . .
3) There needs to be a bridge between the two groups . . . I try to moderate . . . however, hard cases on both sides reduce communication and productive debate . . . Noble thinks he is doing some good but his demeaning approach on GLP is counterproductive . . .
4) I was hoping to make a few here realize the advocates are just people who have a different perspective on the world and some of their concerns are based on rational speculation and skepticism of leadership . . . I guess I have done all I can do as well . . . inspite of all your efforts I still think ICAAIP is likely. . .
 
GeorgeB said:
There needs to be a bridge between the two groups

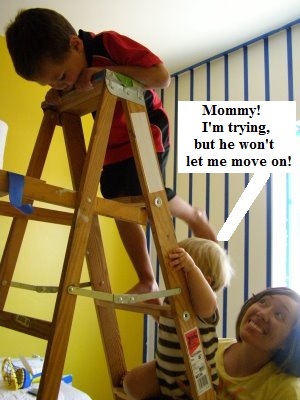
The only connection between a lie and the truth is a ladder that either goes upwards or downwards, you can guess which one lies at the higher level. One who stands in the middle of the ladder can only be an obstacle to those who might ever rise upwards.
 
The only connection between a lie and the truth is a ladder that either goes upwards or downwards, you can guess which one lies at the higher level. One who stands in the middle of the ladder can only be an obstacle to those who might ever rise upwards.

And if there are lies at both ends one compromises . . . you believe you are on a crusade to have everyone believe as you do . . . I have no such motive nor delusion . . . enough said . . .
 
"There is an ongoing large-scale covert geoengineering program."

This statement is either true or false. How can there be "lies at both ends" ?

How can sowing the seeds of doubt be helpful ?
 
And if there are lies at both ends one compromises . . . you believe you are on a crusade to have everyone believe as you do . . . I have no such motive nor delusion . . . enough said . . .

I doubt that's true for Jay, but it's certainly not true for me. I would like people to THINK as I (ideally) do - i.e. with an open yet critical mind, based on science and reason. I don't want to force my beliefs on people, I'm quite willing to change my beliefs in the presence of new information. I also recognize I have limitations of experience and intellect, and cognitive and cultural biases, which means my thought process is nowhere near perfect and always subject to improvement.
 
"There is an ongoing large-scale covert geoengineering program."

This statement is either true or false. How can there be "lies at both ends" ?

How can sowing the seeds of doubt be helpful ?


Some of us with years of experience in and around high level governmental machines have experienced, with their own eyes, the level of deceit that resides within these environments . . . understanding the history, motives, and power manipulation that said entities have shown over the decades . . . I am convinced there are lies at every level . . . I also know that some act first and ask for forgiveness (if at all) later . . .
 

Some of us with years of experience in and around high level governmental machines have experienced, with their own eyes, the level of deceit that resides within these environments . . . understanding the history, motives, and power manipulation that said entities have shown over the decades . . . I am convinced there are lies at every level . . . I also know that some act first and ask for forgiveness (if at all) later . . .

George, my years of experience have shown me that the same situation exists worldwide in every part of society its just a part of the nature of humans.
We have documented deceit and manipulation within the chemtrails promotion power structure which, besides being morally wrong, wasting people's money(look at John Whyte who's out $10's of thousands), generates great negativity, and amounts to a actual threat to human life.

Why do you accept their deceit and manipulation by being a "chemtrails advocate"?

Why not actively join the fight against this?

Is it because you have, some time ago, fallen prey to this deceit and manipulation?

If so, having the knowledge you do now, you should be all the more against them, why not use that knowledge for good, to allow others so manipulated to rise up the ladder and free themselves?
 

Some of us with years of experience in and around high level governmental machines have experienced, with their own eyes, the level of deceit that resides within these environments
I have no reason to dispute that, especially in the light of the party convention last week.

But why implicate this lying with regard to a hypothetical secret program, of all things possible - something invisible, impractical, unprovable and obviously without any effect?

Isn't that a distraction from the lies that are really damaging, like the one that the rich must get even richer in order to improve the situation for the not-rich-at-all?
 
Back
Top