TheCholla
Active Member
I'm starting a new thread to share results from my 3D model for Gimbal, now that I have more objective and accurate results. Please disregard my previous thread when I say I thought the clouds were much closer, I put too much interpretation in visuals when Geogebra 3D does not seem be accurate in that regards for things that are very far apart. I hope @Mick West can delete my previous thread.
The model
First, what is in my 3D model. It's quite simple, I reconstruct the plane trajectory, building from what we learnt in that thread :
https://www.metabunk.org/threads/gi...ates-using-lines-of-bearing-and-or-dcs.11836/
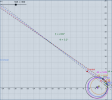
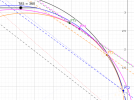
I reconstruct the F18 trajectory using 4 radius circle to follow the changes in bank angles during the video. PT1 is for mark 0'01, PT2 is mark 0'11, PT3 is 0'21, PT4 is 0'31, and PT5 is 0'34. The corresponding azimuths of the objects at each point are 52°, 38°, 20°, -2° and -7°. I use smoothed azimuth angles provided in the thread mentioned above. Here is the trajectory, in the 3D model and in the 2D model I had made before.


This trajectory and azimuth angles give pretty smooth lines of sight (LoS), and the question is whether the object was an UAP before the LoS intersection, or a distant plane after the LoS intersection.
In the 3D model I reconstruct the LoS in 3D using the elevation angle, that we know is in between -2.5° and -1.5°. The cloud cover is represented by a sphere, that moves with the F18 to account for the F18 displacement and curvature of Earth. The cloud cover height can be adjusted, it increases the sphere radius to mimic change in cloud height.

What it says on the clouds
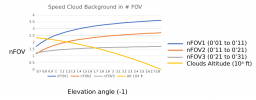
What I do first is to find at which height the clouds need to be to be in the FOV of the pod, for elevation angles -1.5° to -2.5°. In fact I went a bit lower/higher than that to trace the curve below (-0.7 to -2.8) and see things with more perspective.
For a given elevation angle, the cloud height is adjusted to be right in the FOV intersection (I use a FOV of 0.35° and 0.35°cones around my LoS). Then in each configuration I can check how the clouds are "scanned" by the camera from PT1 to PT4. From one LoS to the other, I count the number of FOV scanned by the camera laterally. This is to compare to the lateral cloud motion we see in the video. That's what I was trying to do visually in my other thread, which does not work because the software does not respect the dimensions when zoomed so much. Now I count the number of FOV scanned from PT1 to PT2 (nFOV1), PT2 to PT3 (nFOV2), PT3 to PT4 (nFOV3), objectively by measuring the lateral (orthogonal) distance between the LoS, and translates it in number of FOV.
I've made a plot to show the different nFOV in function of the elevation angle, as well as the corresponding cloud height.

My estimate of the number of FOV scanned in the video is this : NFOV1=3.5 ; nFOV2=2.5; NFOV1=1.5. I consider the FOV length as being the diagonal of the screen, it seems to match better with the numbers of my model. I think it's in agreement with data from this thread : https://www.metabunk.org/threads/automated-motion-tracking-in-videos-like-gimbal-and-gofast.12299/ , if we consider how the clouds traverse the diagonal, not width, of the screen. This is open to discussion though.
In the graph above, we see that before the LoS intersection, i.e. for a cloud height of 20500' and above, the modelled nFOV do not match the video. They are too low.
For the max elevation angle of -2.5°, the cloud height needs to be at least 5000ft to be in the FOV (the true horizon is at -2.8°at 25000ft).
The nFOV numbers from the model start being in good agreement with the video from elevation angle -1.8°, or a cloud height of ~15000 ft.
From this, I estimate that the cloud height must be between 5000ft and 15000ft. It's not a huge refinement but at least it's something.
Now, there is atmospheric refraction at play, and by following numbers mentioned in another thread, the Earth+cloud sphere should be 7/6 times bigger to account for it. Accounting for this, all the numbers above are switched up by 0.2°, so that my optimum interval for the cloud cover height would be 2500ft-13000ft. But atmospheric refraction depends on a lot of things so it's not a sure estimate, just something to keep in mind as far as uncertainties.
In summary the results suggest mid-level clouds. If I had to guess, I would bet on nimbostratus : "The main body of Nimbostratus almost invariably occurs at altitudes between 2 km and 4 km (6 500 ft and 13 000 ft) in polar regions, between 2 km and 7 km (6 500 ft and 23 000 ft) in temperate regions and between 2 km and 8 km (6 500 ft and 25 000 ft) in tropical regions."
Here is an example,they look close to what we see in the video. Could be stratocumulus too, but they are lower and would be on the lower bound of possible cloud height.

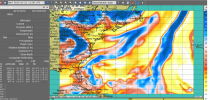
Now this is a wild guess, but looking at the meterological data I shared here : https://www.metabunk.org/threads/me...standing-gimbal-january-20-and-21-2015.12145/
this would match the cloud system that was off Jacksonville, on Jan 21 2015, 11 UTC

Pretty much exactly ~300 miles of Jacksonville, with a wind of 115 Knots around the altitude of the jet (not shown here), and mid-level clouds in the area. But this is just guessing.
About the distant plane trajectory
This is only derived from the 3D LoS, the conclusions are about the same for all elevation angles from -1.5° to -2.5°.

At ~30 NM, the intersections of the LoS with the horizontal give a straight trajectory (shown above), which would be consistent with a plane flying away (at 20200ft for -1.5°elevation, 17000 ft for -2.5°).
I agree this is a strange coincidence, that the LoS are consistent with this. However I find that they are only kinda consistent, because I don't get equal intervals between the plane positions corresponding to PT1 to PT5 of the F18. The intersection points (Plane1 to Plane5) are more distant to each other at the end than at the beginning. Between PT1 and PT2, the speed I get is ~220 Knots, while the speed at the end is ~380Knots. This is an unrealistic acceleration.
Now the values are very sensitive to small changes in the F18 position, so it may be possible to tweak the values to get a constant speed trajectory (I checked, small tweaks in the elevation angle don't do it). The F18 trajectory was really refined to match data from the other thread, so changing it is just guessing at this point. But I will try and see if can retrieve a straight and non-accelerated trajectory with only small changes in the F18 position.
Here it is for a more accurate description of what I see in this 3D reconstruction. I wanted to check by myself what's going on, maybe it will be helpful to others.
Model is here, but not really user-friendly, sorry :
https://www.geogebra.org/3d/azzryzhx
The model
First, what is in my 3D model. It's quite simple, I reconstruct the plane trajectory, building from what we learnt in that thread :
https://www.metabunk.org/threads/gi...ates-using-lines-of-bearing-and-or-dcs.11836/
I reconstruct the F18 trajectory using 4 radius circle to follow the changes in bank angles during the video. PT1 is for mark 0'01, PT2 is mark 0'11, PT3 is 0'21, PT4 is 0'31, and PT5 is 0'34. The corresponding azimuths of the objects at each point are 52°, 38°, 20°, -2° and -7°. I use smoothed azimuth angles provided in the thread mentioned above. Here is the trajectory, in the 3D model and in the 2D model I had made before.
This trajectory and azimuth angles give pretty smooth lines of sight (LoS), and the question is whether the object was an UAP before the LoS intersection, or a distant plane after the LoS intersection.
In the 3D model I reconstruct the LoS in 3D using the elevation angle, that we know is in between -2.5° and -1.5°. The cloud cover is represented by a sphere, that moves with the F18 to account for the F18 displacement and curvature of Earth. The cloud cover height can be adjusted, it increases the sphere radius to mimic change in cloud height.
What it says on the clouds
What I do first is to find at which height the clouds need to be to be in the FOV of the pod, for elevation angles -1.5° to -2.5°. In fact I went a bit lower/higher than that to trace the curve below (-0.7 to -2.8) and see things with more perspective.
For a given elevation angle, the cloud height is adjusted to be right in the FOV intersection (I use a FOV of 0.35° and 0.35°cones around my LoS). Then in each configuration I can check how the clouds are "scanned" by the camera from PT1 to PT4. From one LoS to the other, I count the number of FOV scanned by the camera laterally. This is to compare to the lateral cloud motion we see in the video. That's what I was trying to do visually in my other thread, which does not work because the software does not respect the dimensions when zoomed so much. Now I count the number of FOV scanned from PT1 to PT2 (nFOV1), PT2 to PT3 (nFOV2), PT3 to PT4 (nFOV3), objectively by measuring the lateral (orthogonal) distance between the LoS, and translates it in number of FOV.
I've made a plot to show the different nFOV in function of the elevation angle, as well as the corresponding cloud height.
My estimate of the number of FOV scanned in the video is this : NFOV1=3.5 ; nFOV2=2.5; NFOV1=1.5. I consider the FOV length as being the diagonal of the screen, it seems to match better with the numbers of my model. I think it's in agreement with data from this thread : https://www.metabunk.org/threads/automated-motion-tracking-in-videos-like-gimbal-and-gofast.12299/ , if we consider how the clouds traverse the diagonal, not width, of the screen. This is open to discussion though.
In the graph above, we see that before the LoS intersection, i.e. for a cloud height of 20500' and above, the modelled nFOV do not match the video. They are too low.
For the max elevation angle of -2.5°, the cloud height needs to be at least 5000ft to be in the FOV (the true horizon is at -2.8°at 25000ft).
The nFOV numbers from the model start being in good agreement with the video from elevation angle -1.8°, or a cloud height of ~15000 ft.
From this, I estimate that the cloud height must be between 5000ft and 15000ft. It's not a huge refinement but at least it's something.
Now, there is atmospheric refraction at play, and by following numbers mentioned in another thread, the Earth+cloud sphere should be 7/6 times bigger to account for it. Accounting for this, all the numbers above are switched up by 0.2°, so that my optimum interval for the cloud cover height would be 2500ft-13000ft. But atmospheric refraction depends on a lot of things so it's not a sure estimate, just something to keep in mind as far as uncertainties.
In summary the results suggest mid-level clouds. If I had to guess, I would bet on nimbostratus : "The main body of Nimbostratus almost invariably occurs at altitudes between 2 km and 4 km (6 500 ft and 13 000 ft) in polar regions, between 2 km and 7 km (6 500 ft and 23 000 ft) in temperate regions and between 2 km and 8 km (6 500 ft and 25 000 ft) in tropical regions."
Here is an example,they look close to what we see in the video. Could be stratocumulus too, but they are lower and would be on the lower bound of possible cloud height.
Now this is a wild guess, but looking at the meterological data I shared here : https://www.metabunk.org/threads/me...standing-gimbal-january-20-and-21-2015.12145/
this would match the cloud system that was off Jacksonville, on Jan 21 2015, 11 UTC
Pretty much exactly ~300 miles of Jacksonville, with a wind of 115 Knots around the altitude of the jet (not shown here), and mid-level clouds in the area. But this is just guessing.
About the distant plane trajectory
This is only derived from the 3D LoS, the conclusions are about the same for all elevation angles from -1.5° to -2.5°.
At ~30 NM, the intersections of the LoS with the horizontal give a straight trajectory (shown above), which would be consistent with a plane flying away (at 20200ft for -1.5°elevation, 17000 ft for -2.5°).
I agree this is a strange coincidence, that the LoS are consistent with this. However I find that they are only kinda consistent, because I don't get equal intervals between the plane positions corresponding to PT1 to PT5 of the F18. The intersection points (Plane1 to Plane5) are more distant to each other at the end than at the beginning. Between PT1 and PT2, the speed I get is ~220 Knots, while the speed at the end is ~380Knots. This is an unrealistic acceleration.
Now the values are very sensitive to small changes in the F18 position, so it may be possible to tweak the values to get a constant speed trajectory (I checked, small tweaks in the elevation angle don't do it). The F18 trajectory was really refined to match data from the other thread, so changing it is just guessing at this point. But I will try and see if can retrieve a straight and non-accelerated trajectory with only small changes in the F18 position.
Here it is for a more accurate description of what I see in this 3D reconstruction. I wanted to check by myself what's going on, maybe it will be helpful to others.
Model is here, but not really user-friendly, sorry :
https://www.geogebra.org/3d/azzryzhx
Attachments
Last edited: