MikeG
Senior Member.
Last week, Catherine Frompovich wrote a article for Activist Post that claimed recent heavy rain in southeastern Pennsylvania was geoengineered. After looking through archival data on rainfall in the area, the totals don’t come close to historical records. Frompovich’s secondary claims about “scalar clouds” are also unfounded as are claims about crop damage.
https://www.activistpost.com/2018/05/hell-hath-no-fury-like-weather-geoengineering.htmlDuring the last two weeks in the area where I live, SE Pennsylvania, we experienced an inordinate weather pattern that had everyone—bar none—talking about it and complaining how extraordinarily oppressive it was: Torrential rain daily with no let up, plus no sunshine for days on end!
Question: Was that a subtle food-growing interference technique, since this is the time farmers in this area normally would start plowing and seeding field crops. Growing fields were lakes! Is weather geoengineering another method for introducing what can be considered a ‘natural phenomenon’ causing famine because crops drown in the growing fields? In this area, farmers have experienced some of that in recent years. One year the pumpkin crop was lost!
Physicians I know and network with began telling me how patients were negatively impacted by that oppressive weather pattern, which apparently was generated by a bank of scalar clouds sent in to stall over and supersaturate the region with apparent ‘chemtrail-created’ toxic rain clouds.
I wanted to look at three parts of her claim.
The first deals with rainfall in southeastern PA.
Pennsylvania averages 41 inches of rain each year.
https://en.wikipedia.org/wiki/Climate_of_Pennsylvania
I picked the city of Lancaster as a representative sample site in the southeastern part of the state. It averages slightly more than PA as a whole, 42.81 inches/year.
https://www.usclimatedata.com/climate/lancaster/pennsylvania/united-states/uspa0857
Penn State University has a good website with historical Lancaster weather data.
The average for May rainfall in Lancaster is about 4 inches.
The record for rain in the month of May was inches in 9.47 inches back in 1989. The highest daily amount was 4.06 inches in 1942.
http://www.climate.psu.edu/data/city_information/lcds/lns.php
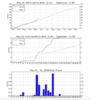
Millersville University, which is located next to Lancaster, Pennsylvania, also collects local weather data. So far, for the month of May, area rainfall was about two inches above normal and almost three inches for the year
http://snowball.millersville.edu/~cws/climo/precip_graphs/precipogram.png
So, although there slightly more rain, it is not “torrential” or dramatically different by any definition
The second part includes the negative health effects of what Frompovich calls “scalar clouds.”
I found references to the term in physics. They are related to black holes, not weather or climate.
https://arxiv.org/abs/1409.1593Massive complex scalar fields can form bound states around Kerr black holes. These bound states -- dubbed scalar clouds -- are generically non-zero and finite on and outside the horizon; they decay exponentially at spatial infinity, have a real frequency and are specified by a set of integer "quantum" numbers (n,l,m).
In reality, these are Altocumulus and Altostratus clouds. CT’s also refer to these normal formations as “HAARP clouds.” Earlier Metabunk threads have already discussed the term.
https://www.metabunk.org/useful-che...es-and-infographics.t1007/page-10#post-146962
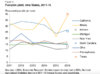
Lastly, there is the “lost” pumpkin crop. I found a good chart from the USDA. The Pennsylvania harvest is slightly down from 2011, but so are the number of acres under cultivation.
https://www.ers.usda.gov/newsroom/trending-topics/pumpkins-background-statistics/