Debunked: Chemtrails and Chembombs Cause Hurricane Isaac to Change Course

scombrid

Senior Member.
http://www.youtube.com/watch?feature=player_embedded&v=d2bWwlohOpE

Harold is claiming that he can see weather manipulation meant to control hurricane Isaac on satellite loops.

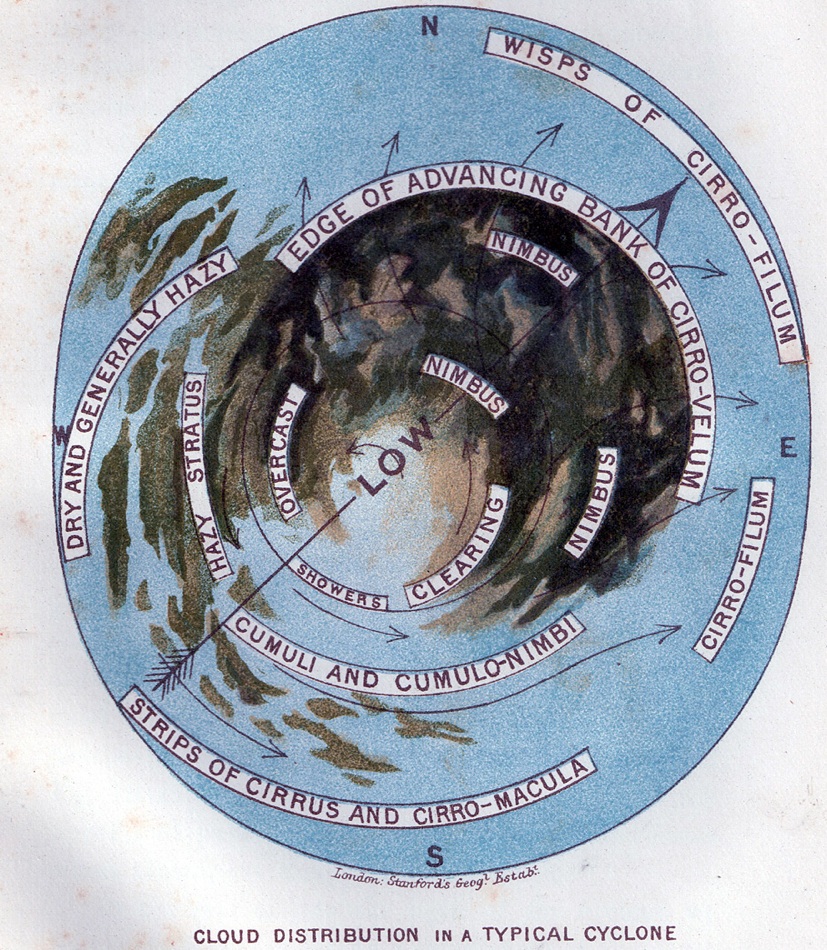
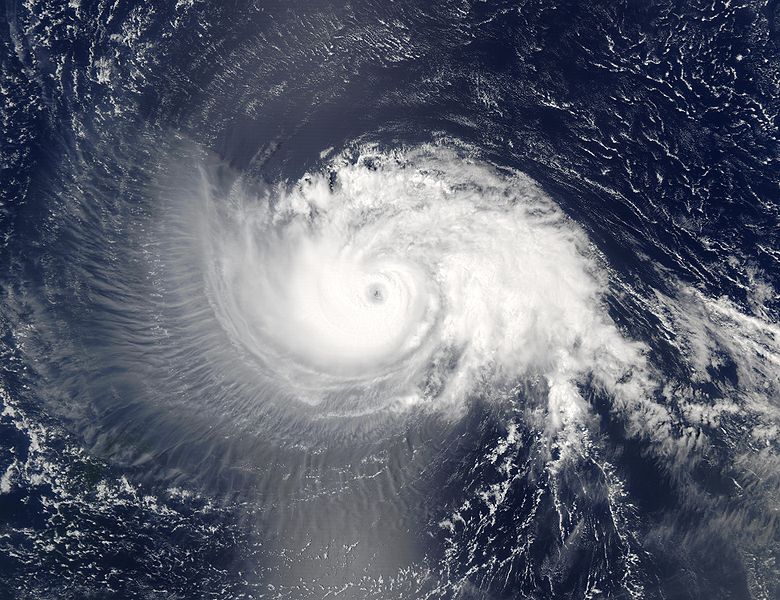
The first half of the video focuses on cirrus clouds around the cyclone. He refers to the cirrus cloulds being aerosols "contributing to the geoengineering of the storm".

What he is actually pointing at are natural cirrus clouds blowing off of the deep convection associated with the storm. It is known as "cirrus outflow".

Here is a description of the cirrus clouds typically associated with tropical cyclones that describes well the images that Harold has placed in that youtube video. It was published in 1967.
http://docs.lib.noaa.gov/rescue/mwr/095/mwr-095-03-0111.pdf
" CIRRUS CANOPIES IN TROPICAL STORMS"


Furthermore. An internet image search for satellite views of major hurricanes such as David in 1979 and Glorida in 1985 show similar cirrus cloud patterns. Clearly Mr. Saive is mistaken, or hurricanes were being manipulated by "aerosol engineering" by the time we had satellites in space and probably before that. The cirrus deck approaching from the south or southeast in advance of a storm has been a warning of an approaching tropical system on the east coast of the US for centuries before we has any modern forcasting techniques or remote sensing capabilities.


be
 
He says at 1:34 that the "aerosol dumps are seen virtually everywhere, in every frame, you cannot scroll without seeing these aerosols". He then rhetorically asks how many aircraft it must take to spray those tons and tons for aerosols.

Well Harold, it takes none sinse those are cirrus clouds flowing off of the top of convective complexes, a phenomenon documented around cyclones before aviation or satellites. But since you are claiming that those clouds covering thousands of square miles are sprayed from airplanes, perhaps you can tell us how many planes it would take to do that and where those planes might be hiding. That would be one large operation for sure.

Did "they" geoengineer Hurricane Gloria in 1985? David in 1979?

How about hurricane Camile in 1969? The resolution is poor in satellite images from 1969 but the cirrus clouds are evident completely surrounding the cyclone and extending up over the southeast CONUS.

http://www.deadlystorms.com/storms/1969/Camille/images/hurr-camille-vis1.gif


hurr-camille-vis1.gif
 
He mentions at 3:15 or so that at the CBC conference that a Bruce Douglas "discussed a new method of aerosol deployment that he called chem bombs that appear as whispy cotton candy clouds". He says those are "replacing long jet trails" and implicates the Evergreen Air 747 as the chem-bomb suspects with the typical canard that the planes weather modification capability is being used for "geoengineering" (those are addressed elsewhere).

It appears that the chemtrails theorists did not notice until this summer that cirrus clouds blow off of the top of intense convective systems. Yes, it is true, the "whispy cotton candy clouds" known as cirrus clouds are more common in summer in the middle latitudes as that is when more intense convective systems like thunderstorms and tropical cyclones occur. Persistent contrails occur year-round but are more common winter in the middle latitudes.

http://www-pm.larc.nasa.gov/sass/pub/journals/Minnis.etal.JClim.03.pdf
"Contrail Frequency over the United States from Surface Observations"

So the chemtail beleivers may be observing a real shift in the frequency of cirrus types and attributing a natural annual cycle to what they perceive as a trend.

Here is a portion of the the abstract from the linked paper. The seasonality of contrails is mentioned as is some interesting information on inter-annual variation.

During both years, persistent contrails are most prevalent in the winter and early spring and areseen least often during the summer. They co-occur with cirrus clouds 85% of the time. The annual mean persistentcontrail frequencies in unobscured skies dropped from 0.152 during 1993–94 to 0.124 in 1998–99 despite a risein air traffic. Mean hourly contrail frequencies reflect the pattern of commercial air traffic, with a rapid increasefrom sunrise to midmorning followed by a very gradual decrease during the remaining daylight hours. Althoughhighly correlated with air traffic fuel use, contrail occurrence is governed by meteorological conditions. It isnegatively and positively correlated with the monthly mean 300-hPa temperature and 300-hPa relative humidity,respectively, from the National Centers for Environmental Prediction (NCEP) reanalyses. A simple empiricalmodel employing the fuel use and the monthly mean 300-hPa temperatures and relative humidities yields areasonable representation of the seasonal variation in contrail frequency. The interannual drop in contrail frequencycoincides with a decrease in mean 300-hPa relative humidities from 45.8% during the first period to​
38.2% in 1998–99, one of the driest periods in the NCEP record.

 
Here's a pre-satellite description of the same thing, from "Cloudland" by W. Clement Ley, in 1894.


Plate VI., which is derived from a diagram
exhibited by the author in a lecture delivered before the Meteorological Society in 1878, represents the cloud distribution in a typical circular progressive cyclone. The large arrow represents the general direction of progression, and the smaller arrows show the direction of the upper currents. We have already learnt that the approach of such a cyclone is generally heralded by " outriders," consisting of wisps of Cirro-filum moving rapidly in the outflowing upper currents to the front and the right-front of the disturbance. These wisps may be more than one hundred miles in front of, but generally are closely followed by a sheet of Cirro- velum, which spreads over the front of the disturbance, and which is usually attached to clouds of Interfret and clouds of Inversion forming the great composite bank of cloud called Nimbus (§ 85), from which we generally get extensive precipitation. These clouds will, of course, appear to be moving in different directions, according to the different altitudes at which they exist, and to the position of the observer with regard to the disturbance.
Content from External Source
 
Last edited:
Back
Top