I suppose he revised his calculations because it wasn’t fitting the original narrative of TTSA that the object must be moving fast 380 Kn at a low altitude of 100 ft)
The question is if the event log fits the objective events.
Here's a theory: occasionally, over the course of a decade, a pilot will lose situational awareness, but not realize it, and then later write down what he recalled observing.
Yes, but what makes this case interesting is that a second jet was involved and its pilot, Jim Slaight, also seems to have lost situational awareness:
Upon noticing the object, David Fravor indicated over the radio “I’m in” to which Jim Slaight replied “I have high cover”. David Fravor conducted an aggressive banking maneuver and dropped his aircraft at the same time in order to catch up with the object.
The object immediately responded. Jim Slaight was worried for David Fravor and his WSO because he thought they wouldn’t stand a chance against the object which conducted maneuvers like no aircraft or missile ever could. The object began to make deliberate changes in altitude, attitude, and angle in a manner that seemed to defy the laws of flight physics and that made any engagement by Fravor’s F18 impossible.
Yes, the video was not made by Fravor, but some time later from another jet at another location - the jet was sent there because the object re-appeared on radar.
Except for the GIGO aspect. He used the composite screenshot from TTSA which had 4.1 RNG at 22°, when the actual angle was 28°. Also got the plane speed wrong, as mentioned above. And he got the time wrong. All of which I think he later corrected.
When assuming how the ATFLIR camera tracks is there anything I should be taking in to account? Can I discount the roll of the aircraft as the camera compensates and translate the camera mount in the x,y,z only?
It would be useful to demonstrate the difference between the ground tracking (based on atltude and angles) and a "snowplow" mode where the camera points in a fixed direction/tilt.
The start of the video (e.g from 00:01 to 00:03) appears to be ground tracking, which kind of gives the illusion it was filmed from a helicopter. If it were in snowplow mode I think the sea would be whizzing by. So that would be good to show.
Mick, but that begs the question of who determined the original narrative of TTSA that the object was flying very fast (380 kn) very close to the surface (altitude = 100 ft.). I don’t think they based it on Macabee’s calculations, which were made March 9 and March 12.
Mick, but that begs the question of who determined the original narrative of TTSA that the object was flying very fast (380 kn) very close to the surface (altitude = 100 ft.). I don’t think they based it on Macabee’s calculations, which were made March 9 and March 12.
They don't say 380 knots there, or anywhere that I know of.
Their analysis there is incredibly weak, and seems to be based entirely on a subjective visual assessment. i.e. they simply think it looks like it's close to the ocean surface. So I suspect whoever did it was a pretty non-technical person, perhaps Elizondo? Whoever it was, it's reflected very poorly on TTSA's technical abilities.
OK, I got those numbers from Garry Nolan. Now that there’s a clearer picture of TTSA incompetence, I will go back and ask Garry where he got those numbers from.
But what is baffling to me is that he did calculate an object altitude of 1.6 nm which I round up to 10,000 feet. And he even made a remark that this altitude is not close to the ground, thus directly contradicting the “Official” TTSA narrative about the object being very close to the water surface. And yet he still ignored the parallax effect of that altitude in his speed calculations.
Mick already noted his error of using CAS instead of TAS, but at least this version shows that BM is not responsible for the official TTSA statement about the object altitude.
Hello @Kaen ! Thank you so much for that diagram above. It is really helpful to explain parallax effect to those unfamiliar with it.
However, before I ask you questions I have about the assumptions made in the diagram, I would like to drop back and punt because I just discovered on FB Bruce Maccabee’s Original calculations made on March 9. (You operated only from his revised calculations dated March 12.) Here is the text of his original calculations. Does it give you any more insight into his process? It looks like his original calculations were more in line with yours, but then I suppose he revised his calculations because it wasn’t fitting the original narrative of TTSA that the object must be moving fast 380 Kn at a low altitude of 100 ft)
Bruce probably based his calculations on a period in the video above where the object crosses the display while the ATFLIR is more or less fixed on the same patch of sea. This is the period from 5,5 s – 7,3 s (duration 1,8 s).
The picture below contains the snapshots of the object entering and leaving the FOV. I projected the object’s end position in the first picture, taking a slight shift of the camera into account (the white rectangle shows the same patch of sea). From these two positions I calculated the percentage of the ATFLIR FOV that the object crossed in these 1,8 seconds.
Let’s go through Bruce's calculations step by step:
Object altitude calculated as: (4.1 nm [height of plane] – (4.1 slant range [plane to object]) x sin 22 = 4.1 – 1.54 = 2.46 below airplane altitude;
[Later he changes the 4,1 nm to 4,5 nm:] The exact distance to the object at that time is not known because the system had not yet locked on. However when it did lock on a short time later the range was about 4.1 nm and decreasing. I therefore "guesstimate" the range at 4.5 nm.
The calculated 2,46 nm is not a ‘below airplane altitude’ but the actual object altitude.
During Bruce’s 1,8 s period, the object slant vector is at a downward angle of 24 degrees, not 22.
Slant range is unknown at that time, but can be estimated: At 12 s it is 4,4 nm and decreasing with 0,1 nm per 1,8 s. So at 6 s in the video the estimated slant range would be 4,4 + (0,1 x 6/1,8) = 4,7 nm, not 4,1 (later 4,5).
This gives an altitude difference between jet and object of 4,7 x sin(24) = 1,9 nm.
Jet is at 4,1 nm altitude so object is at 4,1 – 1,9 = 2,2 nm altitude (13.300 feet), not 2,46.
At 4.1 nm range to the object, the distance across the 1.5 deg FOV is (4.1nm) x [1.5 deg x 0.0174 rad/deg]= 0.1 nm.
[Later he corrects this value for the new range of 4,5 nm:] The width of the FOV is 1.5 deg x 0.0174 rad/deg = 0.026 rad which corresponds to 0.117 nm at 4.5 nm distance.
The actual range is closer to 4,7 nm (see above). This gives 0,12 nm instead of 0,1 (later 0,117 nm).
I wonder whether the 1,5 degrees FOV is correct. I thought this was the FOV at zoom level 2, it may be 0,3 degrees at zoom level 1. This would double the value to 0,24 nm
It crosses the FOV at about a 45 deg angle so the actual approximate distance across the FOV is 0.1 nm/0.707 = 0.14 nm;
[Later he corrects this value for the new range of 4,5 nm:] The object crossed the FOV area at an angle of about 45 deg so the distance traveled as it crossed the FOV was about (0.026 rad) x 1.41(to account for the 45 degree crossing) x 4.5 nm = 0.165 nm.
I made a more accurate estimate of the FOV coverage (see picture above), it is 1,31 so the total distance is 1,31 x 0,12 = 0,16 nm instead of 0,14 (later 0,165 nm).
it crosses in 4 to 3 sec implying a differential speed of the plane and object of 0.14 nm/ ( 4 to 3 sec)/(one hour/ 3600) = 126 to 170 kt)…
[Later he corrects this value to 1,8 s and the speed to 330 kt:] I found that it took about 55 frames at 30 frames/ sec which corresponds to 55/30 = 1.8 sec. It traveled this distance in about 1.8 sec for a speed of 0.092 nm/sec which is about 330 kt....about twice the larger speed previously calculated but certainly not an earth shaking speed.
With the 0,16 instead of 0,165 nm this yields a differential speed of 0,16/1,8 = 0,089 nm/s = 316 kt instead of 330 kt, so very close to Bruce’s value.
Since the plane is going at about 250 kt the object was going at the speed approx. (250 – 150) = 100 kt in the same direction as the airplane but clearly slower)calculation assumes land speed is approx. same as air speed) )))
The 330 kt is a differential speed and needs to be compensated for the parallax effect. Here, Bruce makes some crude approximations using the CAS of the jet, and assuming the parallax compensation equals the jet speed.
In reality the parallax compensation is 0,52 x the jet speed (see my post about the parallax). The camera shifts a little (about 16% of the FOV) along with the object’s trajectory while the object passes. This will add an additional 16% to the parallax compensation speed that I estimated (267 kt instead of 230 kt).
Note that the speed in the ATFLIR display being CAS is solely based on the annotations in the video made by TTSA. Maybe TTSA was wrong and the speed is based on something else like GPS data.
A few additional remarks:
The assumed FOV of the ATFLIR is 1,5 degrees. It may be twice that, i.e., the narrow FOV of an ATFLIR is 3 degrees according this document: https://www.forecastinternational.com/archive/disp_old_pdf.cfm?ARC_ID=452 That would double the computed differential speed of the object to approximately 650 knots.This speed no longer implies a bird or balloon, and it no longer complies with the speeds computed earlier in this thread.
The object seems to travel against the direction of the jet, while other calculations made in this thread indicate it travels in the opposite direction. This is odd.
First of all, the document you link to is an older generation ATFLIR, the NITE-Hawk. Instead of doubling the FOV from 1.5 to 3.0, you may need to cut it in half to 0.7.
The Paracaster calling himself Realm makes an argument that the FOV for this “3rd video” has to be 0.7
I made another effort on finding the FOV for the ATFLIR for better estimates of the target size, and also confirmations on the sensor resolution. Here's what I found:
TL;DR version: the NAR mode most likely has 0.7° FOV, meaning the bird is only half the size of most estimates.
He quotes from a Raytheon brochure:
The fourth generation version of LITENING, built by Northrop Grumman, features the 1024 x 1024 pixels FLIR sensor for improved target detection and recognition ranges under day/night conditions; new sensors for improved target identification; and other advanced target recognition and identification features. Other product improvements include a new 1k charge-coupled device sensor, which provides improved target detection and recognition ranges under daylight conditions.
Notice the Narrow FOV of 0.7
ATFLIR specs (it also lists 4 other products with FPA 640x512 and one with 320x240):
name: Raytheon AN/ASQ-228 advanced sight FLIR(ATFLIR)
detector: InSb FPA 640×480 (centerline space 25μm)
waveband: 3.7~5.0μm
field of view: Wide: 6.0°; middle: 2.8°; narrow: 0.7°
Here again notice the Narrow FOV as 0.7
And @Kaen , notice in the next line that this version replaces the older NITE-Hawk that you linked to above.
ATFLIR specs again:
Raytheon AN/ASQ-228 ATFLIR, recently named Terminator
Dimensions: L: 183 cm/72 in D: 33 cm/13 in W: 191 kg/ 420 lb
Capabilities: 640 480 FPA FLIR operating in MWIR: WFOV 6 6; MFOV 2.8 2.8; NFOV 0.7 0.7
Carrier aircraft: F/A-18A þ , C/D,E/F Replacement for AN/AAS38 Nite-Hawk
When I finally made what I consider to be a close approximation to the video in Blender the parallax looks closest with a fov of 0.7 and an object of 1 meter, the power of the ATFLIR is quite ludicrous this is tracking an object of that size from kilometers away. Hard part of the video is a sea texture that looks close to the video.
Object is ~1 meter
Object is stationary (clearly not the case in reality)
FOV is 0.7
Video is 30 fps, tracking lasts 22 seconds, video is 660 frames camera position keyframes each second based on values from post on this thread by JUSTIN SHAW for the tracking period.
Camera tracks object using a constraint in Blender may not match exact tracking characteristics of the ATFLIR.
It would be helpful if someone could confirm the object's position relative to the camera (x/y) at the start of tracking ie how far in front and to the left it is. I have used 5k left of camera and 5.2k ahead.
First of all, the document you link to is an older generation ATFLIR, the NITE-Hawk. Instead of doubling the FOV from 1.5 to 3.0, you may need to cut it in half to 0.7.
When assuming how the ATFLIR camera tracks is there anything I should be taking in to account? Can I discount the roll of the aircraft as the camera compensates and translate the camera mount in the x,y,z only?
You can discount the roll of the camera, which isn't displayed in any case, but the video is rolled opposite the roll of the aircraft to keep the horizon horizontal so the WSO doesn't get nauseated. See the Gimbal video. The horizon is tilted in the video, but if you rotate your screen counterclockwise the way it it would be in an aircraft, the horizon will be horizontal.
The start of the video (e.g from 00:01 to 00:03) appears to be ground tracking, which kind of gives the illusion it was filmed from a helicopter. If it were in snowplow mode I think the sea would be whizzing by. So that would be good to show.
I wonder if it was in A/G mode or A/A mode. The geopoint ground tracking suggests A/G mode, but all the symbology on the screen resembles the Gimbal video, which was surely A/A.
I think that's a bit misleading as the limits of your axes are not square, so it greatly exaggerates the up/down and left/right motion. If you view it in a 0.2 nm cube it's
A more of less straight line within the rather low resolution we have for angles. Then an odd kink at the end.
Here's the code setting the axes' limits, using NMI for everything for simplicity.
I think that's a bit misleading as the limits of your axes are not square, so it greatly exaggerates the up/down and left/right motion. If you view it in a 0.2 nm cube it's
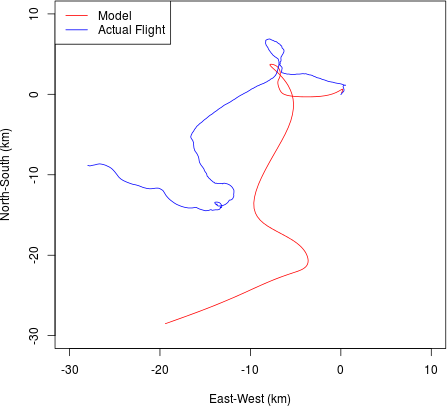
You can't really get one without picking a wind speed and direction. I've been playing with Justin's code, and with the wind at 30,50 and 70 knots (all at 180 degree to the plane's initial heading) the track is radically different. Here the Black dot is the start position, the black triangles are the three end positions. (the red, green, and blue are just the side and top projections).
Notice the 50 knot path ends up near where it started.
Probably we'd need to pick the wind settings that give the best end result in term of matching the motion of the ocean.
You can't really get one without picking a window(sic) speed and direction. I've been playing with Justin's code, and with the wind at 30,50 and 70 knots (all at 180 degree to the plane's initial heading)
Do you mean 'on the nose' ?
At sea level it looks to me to be about 15+ knots, more or less towards the plane (taking into account the the foreshortening of the waves). 30-50 knots at 2.15 nmi altitude seems reasonable.
That kink appears to be a data problem, @JUSTIN SHAW you were duplicating the last values on the change times, end the final time, meaning it appeared to have a drastic slowdown at the end. I've redone it without the kink
Here's a scale image showing the jet's motion (red) the objects motion (black, barely visible) and the track this makes on the ground (i.e. the sea surface at the center of the image when locked on) . The movement of the object has little effect on the ground projection
But notice the jet has a smooth curve, whereas the ground track varies a bit.
The image includes drop lines from the start and ends of the paths to show the height above the ground.
Nice plot @Mick West! I think the conclusion holds: No strange behavior. I'm standing down on this unless we get more data.
Small hint: arange(start, stop, step) will give an array from start up to (but not including) stop. So your "if (WIND_KTS + SPD_STEP < SPD_END):" check is not required. One nice way to get the spdNames populated is to "join" strings with commas. Like this:
speed = arange(SPD_START, SPD_STOP, SPD_STEP) ## make an array of speeds
names = [str(spd) for spd in speeds] ### make a list of string names
comma_sep_names = ','.join(names)
Yes I don't think there's a huge amount to be gained here for fine-tuning the details, there's too much inaccuracy (and unknowns) anyway, but the basic thing is there's a slow moving object around 13,000 feet, and the apparent motion is almost entirely from parallax whichever way you dice it.
Here's using all the data (left) vs just the endpoints (right). The track of the object (bottom) varies more, but the end result (top, green) is the same.
That text file was the roll data used as an input to Justin's code.
The curve I'm plotting are slightly different to the ones shown earlier by Justin as there was a problem with the way wind was handled. The newer code does it better, meaning the angles on the plots now match the numbers.
I can output numbers in script format if you like. Let me know what the actual script looks like that you create with Excel.
GF_Jet_xyx_30kt-180dg.csv is the updated data I'm interested in.
GF_Target_xyx_30kt-180dg.csv is the unknown object?
I'm not exclusively trying to simulate the actual event. Although, corroborating the data presented here would be great.
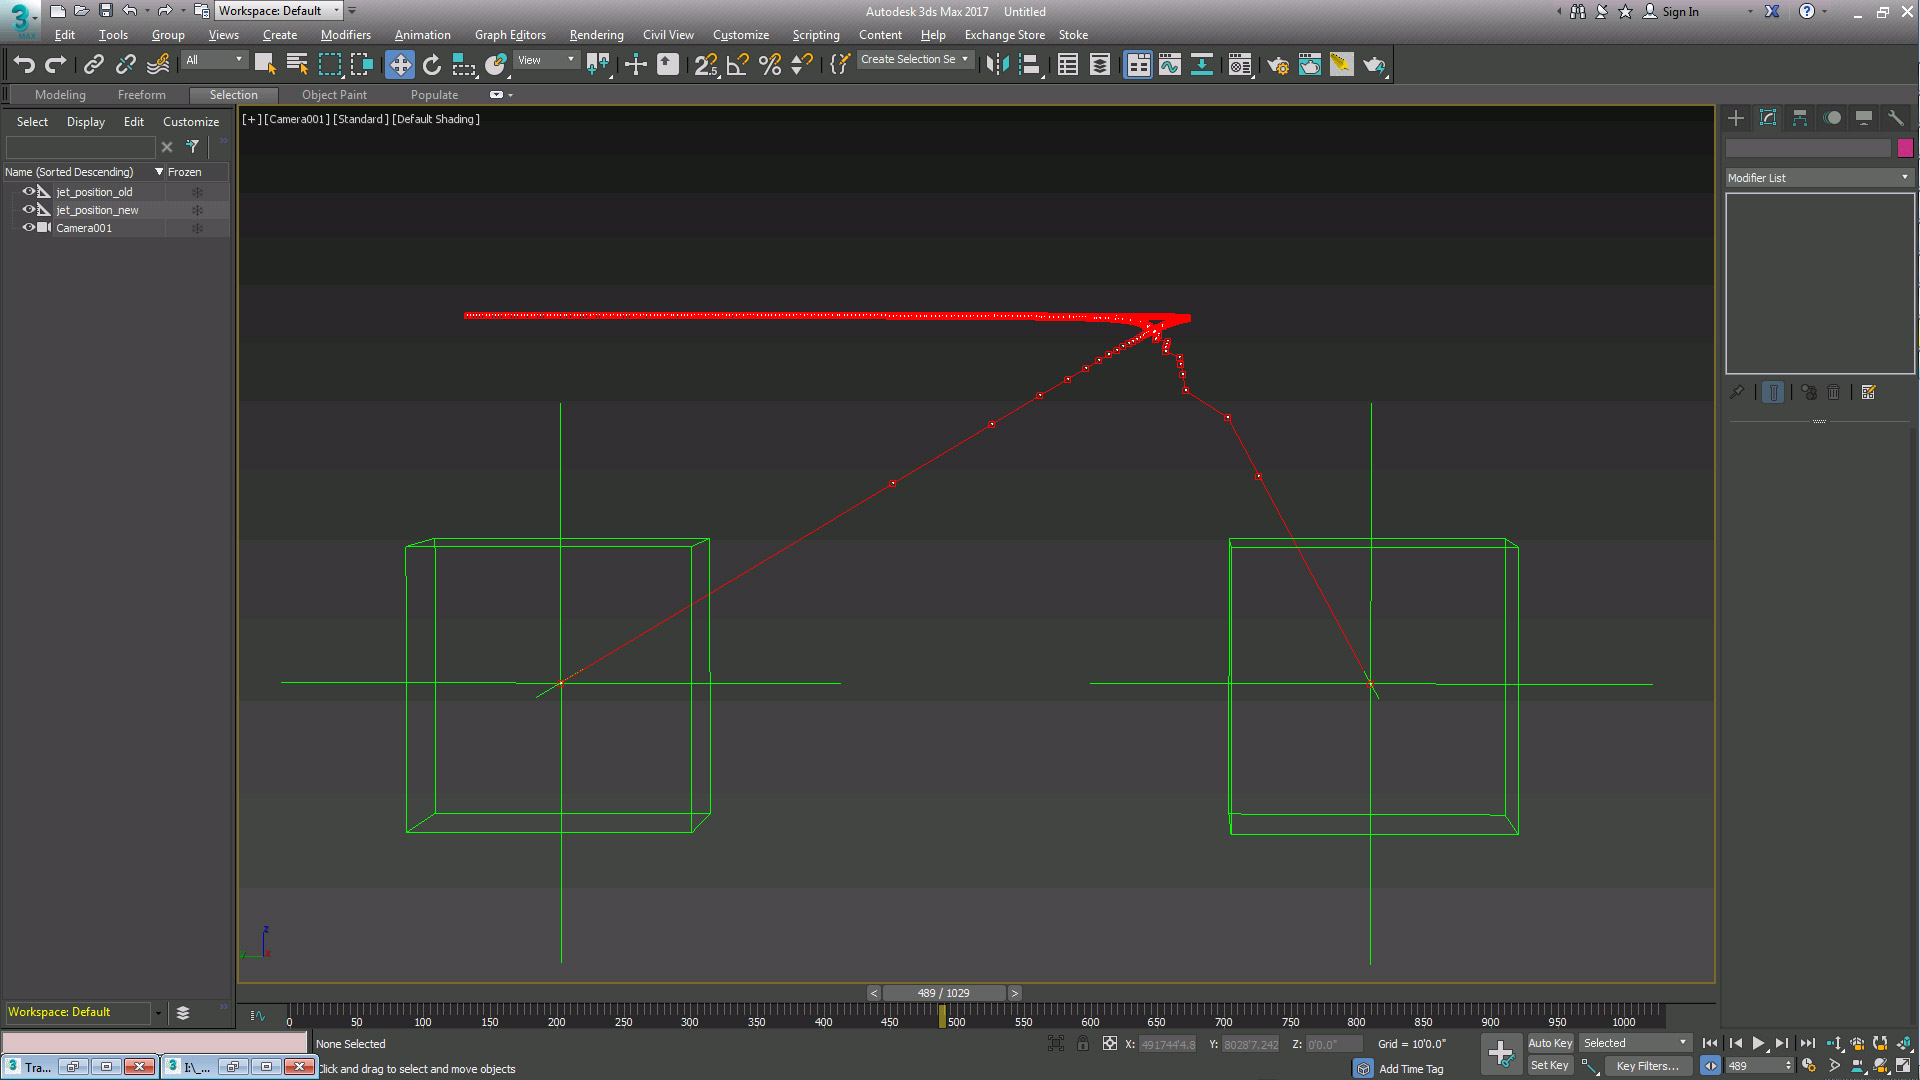
So, I'll wait on trying out the GF_Target_xyx_30kt-180dg data. Right now, I've been trying to backtrack/subtract the object's position in Max based on the known variables.
My interest is combining the hard math posted here with presenting the data in an easily digestible way.
My MaxScript is beginner level. It's the result of me discovering the power of both MaxScript and Excel for animating.
jet_position_.ms is for every frame converted to feet since the scripts I have that calculate speed work only when Max's System Units are set to feet.
Code:
with animate on
(
	  at time 0 $jet_position.position =  [20.8,0,25000]
	  at time 1 $jet_position.position =  [41.5,0,25000]
...
	  at time 1029 $jet_position.position =  [21310.4,1111.5,25000]
)
I've done a few attempts and it seems the raw data for every frame might be too granular.
So, I've been converting the position data into a spline with vertices created for every frame, then normalizing the spline in order to smooth it out for use it as a motion path.
I've been getting fairly consistent results in Max. Altitudes of the object are matching fine.
But, after RNG locks at frame 368 the speed of the object calculated in Max ranges from 45 MPH towards the beginning to 200-300+ MPH on the last 60-70 frames.
This is such a mind bending challenge, as a novice, I've caught myself making mistakes.
The video I made in blender starts at the tracked stage, I just set keyframes for the coordinates of the jet each second and set the framerate to 30fps and then added 660 frames to match the tracked time of 22 seconds.
My MaxScript is beginner level. It's the result of me discovering the power of both MaxScript and Excel for animating.
jet_position_.ms is for every frame converted to feet since the scripts I have that calculate speed work only when Max's System Units are set to feet.
Code:
with animate on
(
at time 0 $jet_position.position = [20.8,0,25000]
at time 1 $jet_position.position = [41.5,0,25000]
...
at time 1029 $jet_position.position = [21310.4,1111.5,25000]
)
I've done a few attempts and it seems the raw data for every frame might be too granular.
So, I've been converting the position data into a spline with vertices created for every frame, then normalizing the spline in order to smooth it out for use it as a motion path.
Jitter might be due to the low number of decimal places of previous data. The jet path seems pretty smooth to me.
I added some code to spit out maxscript for the jet and the target. This is only during the time it is tracked, from 14 to 32 seconds.
Code:
def writeMaxScript(thing,positions):
   outFilename = "GF_"+thing+"_MAX_"+str(WIND_KTS)+"kt-"+str(WIND_HDG_DEG)+"dg.txt"
   f = open(outFilename,"w+")
   f.write("/*\nTrack of GO FAST %s in feet for %d Knots at %d\n%s\n*/\n\n" %(thing, WIND_KTS,WIND_HDG_DEG, infoString));
   f.write("with animate on\n{\n")
   t=0
   for p in positions[:]:
	  f.write("\t at time %d\t$%s_position.position = [%f, %f, %f]\n" % (t,thing,p[0]/FEET,p[1]/FEET,p[2]/FEET))
	  t+=1
   f.write("}\n")
   f.close()


writeMaxScript("jet",poss)
writeMaxScript("target",gs)
which writes:
Code:
/*
Track of GO FAST jet in feet for 30 Knots at 180

Turning, Detailed Data (new)
*/

with animate on
{
	 at time 0	$jet_position.position = [19.072251, -0.002185, 25000.000000]
	 at time 1	$jet_position.position = [38.144503, -0.005828, 25000.000000]
	 at time 2	$jet_position.position = [57.216754, -0.010929, 25000.000000]
	...
}
The data above is per frame, so you can't usefully interpolate more. It could be smooth though, with a moving average or somesuch. However I suspect the higher definition numbers will be smooth.
dt = .0333333333 # time step
t = arange(14, 32, dt) # numpy. returns 1d array from 14 to 32-dt in steps of dt (0.1)
N = len(t)  # nubmer of timesteps in our recreation
Not easily, the code (which is mostly @JUSTIN SHAW's) is focussed on the tracking portion, it would need a bit of restructuring to model the plane outside of that, and even more to get that synced with a moving object.
Not easily, the code (which is mostly @JUSTIN SHAW's) is focussed on the tracking portion, it would need a bit of restructuring to model the plane outside of that, and even more to get that synced with a moving object.
I think that's a bit misleading as the limits of your axes are not square, so it greatly exaggerates the up/down and left/right motion. If you view it in a 0.2 nm cube it's
A more of less straight line within the rather low resolution we have for angles. Then an odd kink at the end.
I trimmed the ends so the data only included where the ATFLIR numbers (angles and range) changed, otherwise it's at a value for an unknown length of time. You could probably extrapolate a bit though. So I start just after the first elevation (dip angle) changes at 13s19f, and end just before the last el change at 32s7f. This was to keep the track the object from kinking at the ends.
The positions are relative to where the jet starts (0,0) so starting earlier will yield different numbers relative to where the object is. But see attached.

")