
skephu
Senior Member.
I have noticed that Dane Wigington has added a new section to his article criticizing the new study:
The graph is essentially incorrect and shows a false trend. The problems with the graph are discussed in environmental scientist Jim Milks' blog here:
James Taylor versus relative humidity and specific humidity.
Basically, the data used to make the graphs are unhomogenized, i.e. changes of the location and type of the instruments have not been accounted for. This produces a false trend. The data come from the "NCEP Reanalysis" data set, which has been criticized in the literature, see:
Dessler, A. E., and S. M. Davis (2010), Trends in tropospheric humidity from reanalysis systems, J. Geophys. Res., 115, D19127, doi:10.1029/2010JD014192.
In fact the relative humidity in the upper troposphere has been increasing, as confirmed by a number of published studies.
The graph below from Dessler and Davis compares several different reanalyses:

This shows the specific humidity at 300 hPa in the tropics. The solid line is the criticized "NCEP Reanalysis" data set, and this is the only one showing a declining trend. The other lines are other reanalyses, showing a slightly increasing trend.
See also:
Chung, E. S., Soden, B., Sohn, B. J., & Shi, L. (2014). Upper-tropospheric moistening in response to anthropogenic warming. Proceedings of the National Academy of Sciences, 111(32), 11636-11641. http://www.pnas.org/content/111/32/11636.full
Also, from skepticalscience.com:
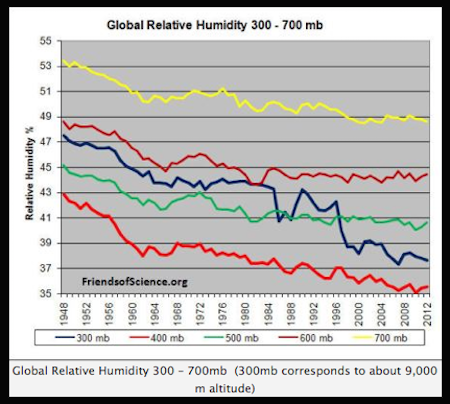
This graph was prepared and popularized by the group named "Friends of Science", which seems to be a climate change denialist group. It is known to be an oil-industry funded astroturf group.Caldiera states above "it is possible that climate change is causing 'contrails' to persist for longer periods than ye used to". Lets examine this statement. For "condensation trails" to increase and last longer there MUST BE more relative humidity in the atmosphere, but is this the case? The global RH graph below could not be more clear, atmospheric RH has been going down for over 60 years.
The graph is essentially incorrect and shows a false trend. The problems with the graph are discussed in environmental scientist Jim Milks' blog here:
James Taylor versus relative humidity and specific humidity.
Basically, the data used to make the graphs are unhomogenized, i.e. changes of the location and type of the instruments have not been accounted for. This produces a false trend. The data come from the "NCEP Reanalysis" data set, which has been criticized in the literature, see:
Dessler, A. E., and S. M. Davis (2010), Trends in tropospheric humidity from reanalysis systems, J. Geophys. Res., 115, D19127, doi:10.1029/2010JD014192.
In fact the relative humidity in the upper troposphere has been increasing, as confirmed by a number of published studies.
The graph below from Dessler and Davis compares several different reanalyses:
This shows the specific humidity at 300 hPa in the tropics. The solid line is the criticized "NCEP Reanalysis" data set, and this is the only one showing a declining trend. The other lines are other reanalyses, showing a slightly increasing trend.
See also:
Chung, E. S., Soden, B., Sohn, B. J., & Shi, L. (2014). Upper-tropospheric moistening in response to anthropogenic warming. Proceedings of the National Academy of Sciences, 111(32), 11636-11641. http://www.pnas.org/content/111/32/11636.full
Also, from skepticalscience.com:
So, ironically, Dane used climate change denialist propaganda to support his point.What does the full body of evidence tell us about humidity?
To claim that humidity is decreasing requires you ignore a multitude of independent reanalyses that all show increasing humidity. It requires you accept a flawed reanalysis that even its own authors express caution about. It fails to explain how we can have short-term positive feedback and long-term negative feedback. In short, to insist that humidity is decreasing is to neglect the full body of evidence.
Last edited by a moderator: